Pandora’s Back Pages
“It’s no easy thing to have come to the conclusion that the rapid deployment of nuclear power is now the greatest hope we have for saving us from an environmental catastrophe. Yet this growing realization has led me to question many of the founding tenets of traditional environmentalism, from the belief that we can dramatically reduce our energy demand through energy efficiency to the belief that solar and wind power will one day power the planet. The almost theological adherence to a set of unquestionable beliefs by most liberals and environmentalists has likely contributed as much or more to prolonging our addiction to fossil fuels as the equally appalling state of denial among many conservatives when it comes to climate change. Both sides are locked into rigid, self-righteous ideological positions with potentially disastrous consequences for us all unless we begin to face the facts...” –From the Director’s Statement.
There are limits to what one can cover in 90 minutes, and some viewers may feel slighted by neglect or oversight of their favorite pro- or anti-nuclear arguments. Books have been written on both; I do not intend another here. Pandora’s Promise attempts to condense sixty-two years of nuclear power and policy history, with additional commentary on modern reactor safety and waste management. Here I merely pull a few threads of Pandora’s backstory, and provide links that support some of the film’s facts and assertions. In Part II we go beyond the film’s initial premise and provide cogent argument, based on extensive integrated climate and economic modeling by our universities and national labs, that it simply will not be possible for renewable sources – wind, water, biomass, and sun – to by themselves provide the huge amounts of global electric energy required to mitigate climate change in the 21st century in anything close to an economic competitive fashion. It is a massive problem that requires integrated solution. Nuclear power will play a critical role.
In particular:
- While not quite perfect, the Generation II light water nuclear power reactors in operation today pose nowhere near the hazard commonly believed. The two accidents (Chernobyl’s was not a Gen II LWR) not withstanding, they remain by far our safest energy source (measured by deaths per TWh produced) available – renewables included.
- Generation III+ light water reactors currently under construction are much simpler and even safer yet by several orders of magnitude, offering operator-free automatic passive shutdown assurance for three to seven days without additional intervention. If necessary, emergency cooling water may be easily replaced from external sources, and emergency circulation is via passive convection.
- Proposed Generation IV fast neutron reactors are “inherently safe”, requiring no operator intervention at all after automatic passive shutdown. They also may burn their uranium fuel sixty to one hundred times more efficiently than Generation II and III light-water reactors, may use current stockpiles of spent nuclear fuel, plutonium, and depleted uranium as fuel, and in the process reduce the final lifetime of high-level waste from the current 170,000 years to approximately 300.
- Our current supply of spent nuclear fuel is sufficient to provide the United States electric power for 100 years at present consumption rates, using such reactors. Our depleted uranium stockpile could power us for 900 more. It would be shortsighted to bury that much useful energy anyplace we can’t retrieve it.
- It is highly unlikely renewable sources alone will be able to satisfy the world’s energy needs in time to forestall the impending climate catastrophe. It is imperative our universities, utilities, and National Laboratories conclude modeling studies and cost-benefit analysis that will show just what combinations of all low-carbon energy sources, in conjunction with judicious carbon taxation or cap-and-trade, will best meet our needs for most rapid abatement of carbon emission, while maintaining economically competitive prices for energy.
- Commercial nuclear power is not going to go much further in the United States – not at the scale needed to meaningfully combat climate change – without a comprehensive National Plan for Nuclear Waste and public understanding of how it will work. The President’s Blue Ribbon Commission on America’s Nuclear Future issued its Final Report in January 2012. It deals with waste issues that include – but go far beyond – the spent nuclear fuel from commercial power reactors. We quote some of the report’s key conclusions. We must develop a National Plan.
- We tactfully suggest present wind and solar Production Tax Credits be modified or replaced in favor of something that might actually result in decreased global emissions of greenhouse gas.
I liked the film. Mr. Stone began research in 2009 and Pandora’s Promise was well underway at the time of the Fukushima disaster of May 2011. I was curious to see how he would deal with Fukushima and Three Mile Island and Chernobyl in a short documentary that advocates questioning and rethinking of many people’s views on nuclear electric power generation. I was not dissappointed: Pandora’s Promise confronts these issues head on, and continues with a brief history of commercial nuclear power in the context of cold war naval propulsion and bomb production, before biting into the meat of fast neutron reactors and how the early nuclear pioneers originally envisioned a future of abundant, safe, and low-cost energy.
Contents
I Pandora’s Premise
2 Introduction to Nuclear Power
3 Breeding Basics
4 Light Water Reactors
5 Some History
6 Fast Neutron Reactors
6.1 Fuel utilization
6.2 Waste management
6.3 Fast Reactor Safety
6.3.1 Ambient pressure operation
6.3.2 Ease of fuel rod replacement
6.3.3 Ease of fuel rod fabrication
6.3.4 Ease of fuel rod reprocessing
6.3.5 Proliferation resistance
6.4 Cost
7 Thorium Reactors
8 Sustainability: how long can uranium last?
9 Light Water Reactor Safety: TMI, Chernobyl, Fukushima, and Generation III+ Reactors
9.1 Three Mile Island 1979
9.2 Chernobyl 1986
9.3 Fukushima Daiichi 2011
9.3.1 The Radiation Release
9.3.2 What Happened
9.3.3 And Why
9.3.4 U.S. Industry Response
9.4 A Nuclear Reactor is not an Atomic Bomb
9.5 Risk in Perspective: Power-related Safety by Energy Source
9.5.1 Risks of Nuclear Energy in Perspective
9.6 Generation III+ Light-Water Reactor Designs
9.6.1 Load Following
II Pandora’s Purpose
10 But “real” renewables are here today, so why bother?
10.1 But I Have a Dream...
10.2 But the Wind Always Blows...
10.3 But It’s a Global Problem...
10.4 But What About China...
10.5 But Renewable Economic Models Look So Good...
10.5.1 The United States: PJM Interconnect Model 2012
10.5.2 Australia: Simplified Lang Model 2010
10.5.3 Australia: Optimized AEMO Model, Draft Report April 2013
10.5.4 The United Kingdom: Low Carbon Future 2011
10.5.5 The United States: Renewable Electricity Futures Study 2012
10.5.6 The World: Pathways for Stabilization of Radiative Forcing by 2100
11 Natural Gas and Production Tax Credits: A Bridge to Oblivion?
11.1 Production Tax Credits
11.2 Carbon Taxes and the War on Coal
12 So What’s the Plan?
12.1 Load Growth Happens: Plan for it
12.2 Waste Happens: Deal with it
12.3 Toward a National Carbon Plan
13 Conclusions
A Resources
B Errata
C Addenda
List of Figures
2 Namie town radiation March 2013
3 Daily Electricity Load Fluctuation
4 U.S. Electric Industry Average Revenue per Kilowatthour, May 2013.
5 RE Futures Electricity Low and High Demand Assumptions
6 Capacity and Mixed Generation results for the Low-Demand scenario REF Figure 2-2.
7 Electric system costs and 2050 retail electricity prices as renewable levels increase
8 Emissions of main greenhouse gases across the RCPs 2000 - 2100
9 Trends in concentrations of greenhouse gases 2000 - 2100
10 Global primary energy consumption by energy source, and annual GHG emissions in four scenarios 2005 - 2095
11 Electricity generation by technology type in the RCP4.5 scenario 2005 - 2095
12 Proportion of Global Energy Consumption from Carbon-Free Sources: 1965-2012
13 U.S. CO2 Emissions by Source
14 Primary Energy Consumption by Source and Sector, 2011 (Quadrillion BTU)
15 U.S. Energy Consumption and CO2 Emissions by Major Fuel Type
16 Representative U.S. cumulative GHG emissions budget targets: 170 and 200 Gt CO2-eq
17 Business as Usual: U.S. Electricity Generation by Fuel 2011, 2025, 2040
18 Time Evolution of Radiotoxic Inventory of Spent Nuclear Fuel.
List of Tables
2 Deaths per TWh by energy source.
3 EIA: Levelized Costs of New Generation by Source in 2018.
4 PJM 2012: Capacity and energy of the cost-minimized mix for 2030 technology costs
5 PJM 2012: Cost to make load using renewables, storage, and fossil backup
6 Median temperature anomaly over pre-industrial levels: four AR5 RCPs
1 Cast and Contributors
Pandora’s technical contributors included Tom Blees and Barry Brook.
Professor Barry Brook holds the Sir Hubert Wilkins Chair of Climate Change at the School of Earth and Environmental Sciences at the University of Adelaide, is co-author of Why vs Why: Nuclear Power, and hosts the respected Brave New Climate blog. His site includes excerpts from Dr. Till’s book Plentiful Energy: the Story of the Integral Fast Reactor.
Tom Blees is president of the The Science Council for Global Initiatives, and is member of the selection committee for Russia’s Global Energy Prize for energy research. He is also on the board of The World Energy Forum, a UN and World Bank-affiliated organization whose goal is providing abundant energy for all mankind, and author of Prescription for the Planet. Tom has a 3-part YouTube video on Integral Fast Reactors.
Pandora’s Promise does not lack for technical expertise. After the spectacular opening sequence showing the dreams of Fukushima Daiichi going up in smoke, Pandora back traces sixty years to the dawn of the nuclear power age a few miles south of Arco, Idaho, with explanation of the EBR-I project by project engineer Leonard Koch. (See Koch: Remembering the EBR-I.)
Part I
Pandora’s Premise
2 Introduction to Nuclear Power
The original “fast breeder” concept was developed by Enrico Fermi during the Manhatten Project of the mid 1940’s. Fermi is famous for having built the world’s first atomic piles at the University of Chicago. These were (relatively) primitive affairs that served as testbeds for research into reactor stability and the physics and chemistry of uranium transmutation to plutonium.
Naturally occuring uranium consists of two isotopes: it is 99.3% stable U-238 and 0.7% active U-235. The latter may be split by a slow “thermal” neutron to release two or three neutrons, two daughter decay nuclei of roughly similar mass, and about 200 Mev energy. The energy comes from the electrostatic repulsion of the two daughters, and some is distributed to the neutrons with a mean energy of about 2 Mev each. These are “fast” neutrons, and are too energetic to react readily with other heavy nuclei. “Not readily”, however, is not the same as “not at all”. There are two processes competing in a nuclear reactor core. One is fission, the second is neutron capture. Fission releases the energy for which the reactor was built. Neutron capture leads to transmutation to an element of higher atomic number and mass, and is the mechanism by which plutonium is bred from .
3 Breeding Basics
- Fissile fuels may be fissioned (split) by slow “thermal” neutrons. The important fissile fuels are Uranium-233, Uranium-235, and Plutonium-239.
- Fissionable fuels may be fissioned by fast neutrons. U-238 may be used as a fissionable fuel in a fast neutron reactor. But fast neutrons may fission all other actinides as well. (This might be a good time to bookmark your local Periodic Table of the Elements, and keep it handy.)
- Fertile fuels do not fission directly, but instead first capture one of the neutrons released by a prior fission process to breed a heavier isotope of the same element, then undergo a series of two beta decays to form a fissile isotope of an element with atomic weight one greater and atomic number two greater than the original fertile element. The important fertile fuels are Thorium-232 (essentially all of mined Thorium) and Uranium-238 (99.3% of mined Uranium), which respectively breed Uranium-233 and Plutonium-239.
All commercial power reactors breed some fuel this way, but today’s solid oxide fueled light water moderated thermal reactors don’t breed enough new fissile Pu-239 from the fertile U-238 to make up for the amount of fissile U-235 they consume. This is because today’s reactors use the mined uranium-plutonium cycle in a moderated neutron spectrum. A faster spectrum is required to produce more Pu-239 than U-235 consumed. Nonetheless, a typical light-water reactor obtains about one-third of its energy from converted Plutonium.
Which in the overall scheme of things still isn’t very much. A light-water reactor’s primary fuel is U-235, enhanced about another 33% by bred plutonium. But the primary U-235 constituted only 0.7% of the original mined uranium ore. The other 99.3% was U-238 that either remained unused in the fuel rods (except for the little bred to plutonium), or was stored as a highly pure depleted uranium by-product of the fuel refining process. Overall a light-water reactor consumes less than 1% of all the energy available in the original uranium ore.
4 Light Water Reactors
There are several natural negative reaction feedbacks. First, as the water heats up, it becomes less efficient as a moderator, which tends to stabilize the reaction at a given temperature. If additional power is desired, the plant operators have to further withdraw the neutron-absorbing control rods to obtain sufficient neutrons to sustain a hotter, more power-producing reaction.
Second, if the reactor leaks and loses coolant, it also loses moderator and efficient thermal neutrons. The chain-reaction then quenches and the reactor stops.1
Except a solid-oxide fueled light water reactor doesn’t stop completely. The chain reaction itself stops completely. But all those daughter products that have accumulated in the fuel rods – Neodymium-148, Caesium-137, Strontium-90 and the like – are themselves radioactive with half-lives from 10 to 40 years. Plus there’s a host of much shorter-lived isotopes, all of which continue to decay and release heat. Sufficent heat to melt the fuel rods if cooling water is not promptly resumed. This is what happened at Three Mile Island and Fukushima Daichi. Solid-oxide fueled light-water reactors are not very forgiving.
The unforgiving nature of solid-oxide fueled LWRs was recognized at the outset. Though conceptually simple, they nonetheless require layered safety systems to prevent catastrophic core failure. And even those don’t always work. Fukushima was particlarly tragic in this regard, because everything did work. The earthquake struck. The seismic sensors tripped and automatically shut down the reactors (inserted control rods) and simultaneously started the emergency generators to run the cooling pumps if the AC grid went offline. Which it did. Then the tsunami topped the Fukushima seawall and flooded the air intakes of the running diesel generators. And their backup backup batteries as well.
Oops.2
5 Some History
Meanwhile, there was a Cold War to be won. There was a pressing need for submarine superiority, and Admiral Rickover deemed light-water reactor designs the fastest way to get there. One can hardly argue his decision: USS Nautilus was authorized in 1951 and launched just three years later with a reactor unit built by Westinghouse. Light-water reactors subsequently became the backbone of the U.S. Nuclear Navy.3
President Eisenhower delivered his famous Atoms For Peace speech to the United Nations General Assembly in December 1953. The proposal had several purposes, not all of them realised. Of those that were, one of the more far-reaching concerned the open sale of U.S. commercial nuclear power technology to other nations in need ot low-cost, reliable electric power. In the 1950’s “commercial” meant light-water reactors, as that was what U.S. industry had gained most experience with through naval propulsion. As result, apart from one or two prototype sodium fast reactors,4 and a handful more (originally) dual-purpose graphite-moderated thermal reactors, all in the Soviet Union or its remnants, most of the world has adopted light-water technology for commercial nuclear power generation. (See The Enduring Effects of Atoms for Peace.)
6 Fast Neutron Reactors
But light-water reactors are simple. They present engineering challenges galore, but the fundamentals are simple. What piqued Enrico’s Fermi’s interest was that other 99% of the energy in mined uranium ore that goes unused in light-water reactors. That, and the long-lived transuranic actinides that accumulate as waste by-product of the Uranium-Plutonium chain reaction. Plutonium-239 is only the first, and itself may undergo neutron capture to form heavier plutonium isotopes plus those of Americium and Curium and some Californium as well. All these elements are long-lived radioisotopes that significantly complicate light-water reactor waste management.
(At this point the reader may wish to re-visit her local Periodic Table of the Elements, if she hasn’t done so already.)
As hinted above, a reactor that incorporates a fast neutron spectrum (fast reactor) has the possibility of addressing both issues. Fast neutrons can fission all the isotopes of all the actinide elements. But none of them capture a fast neutron readily. The challenge is to create a reactor environment with a high enough fast neutron flux density to fission the tough-to-crack non-fissile isotopes (i.e., most of them) while simultaneously preserving sufficent slow neutrons to split the fissile U-235 (if any) and Pu-239 and sustain the reaction without breeding more transuranic actinides than the fast neutrons can burn, You might wish to do all this and breed more Pu-239 from U-238 than you had U-235 (or Pu-239) to start with. Because if you can, you may then perpetuate the entire cycle on bred Pu-239 alone while maintaining heavier transuranic actinides at a low and constant level.
Breeding more Pu-239 from U-238 than your original U-235 requires more fast neutrons than are available in a light-water moderated reactor. Fermi’s approach was to replace the water coolant with low-melting liquid sodium metal which is largely (but not completely) transparent to neutrons and does not slow them down nearly as much as does water. There are several major advantages to this liquid-metal fast neutron arrangement, and a relatively minor drawback.
Sodium metal melts at 98 C (208 F) and boils at 883 C (1621 F) at atmospheric pressure. Specific heat capacity is roughly one-fourth that of water but heat transfer is higher over a temperature gradient due to the higher thermal conductivity of metals relative to water. Molten sodium is non-corrosive to steel, making it easy to work with inside a reactor. It does, of course spontaneously ignite in air producing a relatively cool flame and dense smoke, and reacts rather more spectactularly with water. Precautions must be taken to prevent both.
In some designs sodium metal may be replaced with a lead-bismuth eutectic (lowest melting mixture, abrevieated LBE), which melts at 124 C. Sodium has the advantage of being very inert and unreactive under internal reactor operating conditions. On the other hand, while being more corrosive to steel while molten, lead-bismuth is very inert after it cools down and solidifies, making it convenient for long fuel-life small modular reactors intended to be shipped fully fueled to a power generation site, run for perhaps sixty years, then be shipped back to the factory for refueling. Lead also boils at much higher temperature – 1670 C (3,040F) – opening the possibility of reactors designed to produce process heat for chemical refining and production, including hydrogen. The Soviet Union powered their Alfa-class submarines with LBE fast reactors throughout the cold war, and Russia leads the world in current lead-cooled fast reactor design. One might note that HTGRs (High Temperature Gas Reactors) may offer much the same SMR and process heat advantages, whilst simulataneously getting the lead out. (See EM2.)
There are several advantages liquid-metal cooled fast neutron reactors enjoy over their light-water thermal reactor counterparts:
6.1 Fuel utilization
The fast neutron spectrum allows essentially complete burn-up of all actinide elements and long-lived waste products. This includes all the U-238 in the original fuel and mined ore, the Pu-239 bred in the reaction, plus all the long-lived transuranic radioisotopes of Americium, Curium, and Californium. (And Protactinium, should Thorium be part of the fuel cycle.) All that remains are the relatively short-lived ( 40 year half life) fission daughter products.
6.2 Waste management
The United States currently hosts some 70,000 tons of spent LWR fuel rods. The principle perceived problem with geological disposal is the relatively long half-lives of the transuranic minor actinides, necessitating safe disposal for time periods exceeding several tens of thousand and possibly several hundred thousand years before radiation levels drop beneath that of naturally occuring uranium. An oft-quoted figure is 170,000 years.
As explained by Gweneth Cravens in Pandora’s Promise, that 70,000 tons spent solid LWR fuel is enough to fill an entire football field to a depth of ten feet.5 In contrast, the U.S. currently emits some 5.3 billion metric tonnes CO2 gas into the atmosphere each year, of which over 2 billion tonnes are from electric power generation alone. 6 A single 560 MW LWR nuclear plant, such as the recently retired Kewaunee unit in Wisconsin, produces about 5 TWh of electric power each year (at 90% capacity factor). At 890 tonnes CO2/GWh for coal and 500 tonnes CO2/GWh for natural gas,7 this single plant saved an equivalent of 4.5 million (coal) or 2.5 million (NG) tonnes CO2 from being emitted into the atmosphere each year, or 180 (100) million tonnes over its forty-year lifetime.
Yet managing a tenth of one percent this weight in solid “waste” accumulated over the entire nearly sixty years of commercial power generation is beyond our present U.S. (political) capability. If there were enough of them, fast neutron breeder reactors could use that spent LWR fuel to provide the entire U.S. electric power requirement, at current levels, for 100 years. The total high-level waste resulting from such extended operation would amount to perhaps one-fifth the weight, and need to be stored for only 300 to 600 years before its radiation level subsided to beneath that of natural uranium.8 Many cities are older than that; the storage timescale would be reduced from geological to merely historic.9 (Update 12/22/2013: See figure 18).
For this reason some countries, notably Sweden, Canada, and France, have designed repositories to permit future recovery of the spent LWR fuel material should the need for fast breeder reactors be realized.10 U.S. reliance on light-water reactors with a uranium-oxide once-through fuel cycle results from combined political and technical decisions. U-236 buildup limits PUREX reprocessing (described below) to a single pass, but increases uranium fuel utilization by a not-insignificant 30%. However, the Ford administration felt the plutonium proliferation risks associated with PUREX outweighed this benefit, and decided commercial U.S. nuclear fuel utilization would be single-pass, after which the spent fuel should be either sequestered or disposed (buried). This policy was affirmed by the Carter administration and those that followed. Current NRC policy requires retrieval be possible for at least fifty years.11 As highlighted in Pandora’s Promise, the U.S. government’s Integral Fast Reactor program at Argonne National Laboratory, intended to demonstrate commercial utilitization of spent light-water nuclear fuel as fast neutron reactor fuel, was cancelled in 199412 – with the predictable result that international collaboration on fast reactors and fuel cycles has since shifted to Russia.13
6.3 Fast Reactor Safety
There are several design differences that allow fast neutron reactors to be inherently safer than their light-water counterparts. Here we consider liquid metal-cooled fast reactors, defering discussion of High Temperature Gas Reactors for later.
6.3.1 Ambient pressure operation
The most popular light-water reactors are pressurized water reactors (PWR) that operate their primary water moderator–coolant at about 300 C, which requires several thousand psi to keep the water in its liquid state. That’s a lot of hot water under a lot of pressure, and requires a sturdy large-volume containment structure to contain the whole mess should the pressure vessel or its associated plumbing suddenly and inadvertently spring a massive leak. (To date none ever have, but one needs the containment just in case. It did prove useful at Fukushima.) In contrast liquid metal coolants boil at 883 C (sodium) and 1,670 C (lead-bisthmuth eutectic) at atmospheric pressure. Metal-cooled fast reactors operate at about 600 C and are pressurized with just a few psi inert gas to prevent oxidation of the coolant. A fast reactor vessel is not pressurized in the same sense as a PWR, and the safety containment structure may be of much smaller volume and lesser resistance to potential internal pressure stress.14
EBR-II and the Integral Fast Reactor were piped-pool designs in which the primary molten sodium coolant was held in a large “pool” tank with openings only at the top and smothered in a blanket of inert Argon gas. The reactor core and secondary loop heat exchanger and its associated piping were all lowered in through the top of the reactor vessel, into which there were no other openings. “A guard tank surrounded the primary tank with an annulus between them which allowed for detection of sodium leakage. The guard tank was in turn surrounded by concrete shielding which acted as a final containment vessel. Were leakage to occur in both the primary and guard tank, the core would not be uncovered and would be adequately cooled. An inert gas (argon) filled the space between the tanks and their cover.”15 This very simple unpressurized double-tank + concete smooth-wall design promoted safety from a loss-of-coolant accident (LoCA) by the simple expedient of providing no path or mechanism by which excessive primary coolant could be lost. Liquid sodium is itself non-corrosive and does not react with the steel vessel or metal fuel. In 30 years of operation there were no sodium leaks from the inner reactor vessel at EBR-II into the inert void between the guard tank.16
6.3.2 Ease of fuel rod replacement
Further, the unpressurized reactor vessel allows fuel rod repositioning and replacement on an on-going basis. In contrast, a light-water reactor must be shutdown for one or two months for fuel replacement. Fuel rods must be replaced, not because their nuclear fuel is depleted, but rather because many of the reaction decay products are themselves neutron absorbers that eventually poison and stop the chain reaction. At this point the fuel rods must be replaced, even though typically only 3% of their fissile fuel has been burned.17 In a light-water reactor this necessitates reactor shutdown and depressurization, and dissassembly of the pressure vessel cap, before the fuel rods can be repositioned or replaced. As consequence, fuel rod replacement is delayed until neutron poisoning becomes severe and daughter-decay a significant source of latent heat.18
Metal-cooled fast reactors operating at ambient pressure have no such constraint. Individual fuel rods may be withdrawn for reprocessing on an ongoing staggered basis, thus minimizing the total load of hot daughter products in the core. Further, the high thermal conductivity and high negative coefficient of reactivity of both the liquid metal coolant and the reactor core itself (due to thermal expansion of sodium coolant and the fuel rods and their support matrix) allows reactor designs that will passively limit their power output to low safe levels should power be lost to the secondary coolant loops that extract heat for the electric power generators. This “inherently safe” or “walkaway safe” property was demonstrated at the EBR-II reactor, and highlighted in Pandora’s Promise. These tests are described at Experimental Breeder Reactor II.
6.3.3 Ease of fuel rod fabrication
Fast reactors may have an additional distinction from light-water designs in the construction of their fuel rods. Commercial light-water reactors use fuel rods comprised of pellets of uranium oxide encased in zirconium cladding. Oxides are not good conductors of heat, so individual pellet temperatures tend to run high even during normal reactor operation, and decay heat can more readily lead to fuel element thermal damage in a loss-of-coolant situation. The Integral Fast Reactor design in particular promotes unclad solid metal fuel alloys of Uranuium-Plutonium-Zirconium rather than zirconium-clad oxides, which both greatly enhances the fuel’s thermal conductivity, and simplifies fuel rod construction. The latter is an especially important consideration in integral designs where the fuel rods are expected to be replaced at frequent intervals, reprocessed for decay-product removal, then refabricated to new rods, all done robotically on-site.
6.3.4 Ease of fuel rod reprocessing
The pyroprocessing methods to be used for fast reactor fuel recycling differ drastically from the older PUREX method used for conventional light-water fuels. PUREX (Plutonium-Uranium Extraction), dissolves the entire used fuel assembly in acid solution, then selectively extracts just the unburnt uranium and plutonium for reuse. The remaining solution contains both the long-lived transuranic actinide neutron capture products, and the short-lived reaction daughter decay products, lumped together in one place for disposal. PUREX, originally developed to extract plutonium for weapons, is expensive, has in the past produced copious amounts of liquid waste, and raises proliferation concerns in some quarters. (But PUREX is not completely without merit. See See Processing of Used Nuclear Fuel .)
Pandora’s Promise illustrated LWR waste volume reduction at a storage facility in Paris, France. However, the long-lived transuranic actinides still pose a radiation hazard for roughly 170,000 years, after which time any remaining Pu-239 and its U-235 decay product would (theoretically) be ripe for mining.
In constrast, in metal fuel pyroprocessing the used metal fuel is first simply melted. Volatile decay products such as xenon and iodine are recovered from the inert atmosphere, while metallic decay products (notably caesium and strontium) are removed by electrowinning (electroplating) techniques. The remaining molten fuel contains fissile uranium and plutonium, plus all the remaining transuranic actinides. Even solidified it is both thermally hot and highly radioactive, making an uninviting proliferation target. This metallic mixture is then recast into new fuel rods for reuse in the reactor, where all components – including the transuranics – are subject to fission by fast neutrons.19 The decay products that are removed mostly have half-lives less than 40 years. “There will be dramatic reductions in the toxicity of wastes to be disposed of. Best current estimates are that fast-reactor recycle will reduce net long term toxicity by something like two orders of magnitude. The final wastes can easily be tailored to an appropriate form for optimum security: long-lived isotopes in a metallic waste form (which can be highly corrosion resistant in the repository), shorter lived materials in ceramic waste forms. Radioactivity in a repository will reach background levels in less than 500 years.”20
6.3.5 Proliferation resistance
Pyroprocessing cannot extract plutonium from spent nuclear fuel (SNF) with the chemical purity needed for bombs. Further processing would be required, even if the isotopic purity were acceptable, which it is not.21 Plutonium in a commerical power reactor accumulates about 25% of the unstable isotope Pu-240, which undergoes spontaneous fission with sufficient frequency to make bomb production highly impractical. Presence of thermally hot Pu-238 (used in radioisotope thermoelectric generators) further complicates matters, as heat alone can degrade and/or destabilize the chemical explosives intended to trigger the bomb.22 All in all, relative simplicity of uranium bomb construction and modern ultra-centrifuge designs make enrichment of readily-mined uranium a much more attractive target for proliferation than diversion of plutonium from spent commercial nuclear reactor fuel. That said, we aren’t talking horseshoes or hand grenades: impractical complexity notwithstanding, any reactor or fuel-cycle program must be subject to strict security and stringent international monitoring.
6.4 Cost
As only two fast reactor for commericial power generation – Russia’s BN-600 and France’s Phénix – have seen extended operation,23 the actual capital cost and O&M (operations and management) estimates for such units contain some uncertainty. Their unpressurized design and resulting lack of need for pressure vessel and large containment structure should drastically reduce construction cost of the reactor assembly and containment themselves. On the other hand, whether done on-site (IFR) or at a central location (small modular reactors), fuel re-processing is expected to be considerably more expensive than our present once-through burn-it-and-bury-it approach to conventional LWR spent fuel (that has thus far not proved politically feasible in the U.S.). It is hoped the increased cost of fuel reprocessing will be largely offset by the cost saving of reactor vessel and containment building. But this will certainly not be the case for early production units, and while readily managable, the final decay waste must still be sequestered for a significant interval. (See Cost Comparison of IFR and Thermal Reactors.)
7 Thorium Reactors
The Uranium-Plutonium ( – – ) fuel cycle is not the only one suited to nuclear power reactors. The Thorium-Uranium ( – ) cycle was proposed in 1950, and an experimental reactor to exploit an elegant liquid-fuel design was built and operated at Oak Ridge National Laboratoy in the 1960’s. Although the Thorium molten-salt fuel arrangement is in many respects much simpler than the solid metal fuel used in modern IFR designs, for a variety of political and weapons-related reasons the technology has recieved no government support since that early ORNL effort. It has, however, continued to attract theoretical attention from reactor designers worldwide, notably in China. Pandora’s Promise could only cover so much, and in any event proven liquid Thorium technology is much less advanced than Uranium-Plutonium fast breeders, of which over fifty have been built (both experimental and naval propulsion) and for which commercial power designs are ready for deployment today. Although moderated thermal thorium plants should produce but 2% the long-lived actinide waste of their uranium counterparts, thorium offers no particular advantage over uranium in most fast neutron reactor applications.24 It may, however, provide unique properties in the Accelerator-Driven Systems (ADS) designs proposed for possible end stages of high-level waste burnup. In any event, choice of reactor technologies should be driven by the twin goals of minimizing both global carbon emissions and the lifetime of high-level nuclear waste.25 A standard reference is Liquid Fluoride Thorium Reactors by Robert Hargraves and Ralph Moir. A brief history and description of thorium fuel cycles useful in various reactor designs (not just molten salt) is WNA’s Thorium. Thorium technology is chronicled at Energy From Thorium. See The IFR vs the LFTR: An Exchange for an informed expert discussion.
8 Sustainability: how long can uranium last?
These issues are detailed in (a rather lengthy) WNA article Uranium and Depleted Uranium, from which we find world depleted uranium stock is about 1.5 million tonnes, increasing by 50,000 tonnes each year. Known Recoverable Uranium Resources were 5.3 Mt in 2011 at US $130/kg U. However:
“The price of a mineral commodity also directly determines the amount of known resources which are economically extractable. On the basis of analogies with other metal minerals, a doubling of price from present levels could be expected to create about a tenfold increase in measured economic resources, over time, due both to increased exploration and the reclassification of resources regarding what is economically recoverable.
“This is in fact suggested in the IAEA-NEA figures if those covering estimates of all conventional resources (U as main product or major by-product) are considered - another 7.6 million tonnes (beyond the 5.3 Mt known economic resources), which takes us to 190 years’ supply at today’s rate of consumption. This still ignores the technological factor mentioned below. It also omits unconventional resources (U recoverable as minor by-product) such as phosphate/ phosphorite deposits (up to 22 Mt U), black shales (schists) and lignite (0.7 Mt U), and even seawater (up to 4000 Mt), which would be uneconomic to extract in the foreseeable future, although Japanese trials using a polymer braid have suggested costs a bit over $250/kgU. Research proceeds...
“Unlike the metals which have been in demand for centuries, society has barely begun to utilise uranium. As serious non-military demand did not materialise until significant nuclear generation was built by the late 1970s, there has been only one cycle of exploration-discovery-production, driven in large part by late 1970s price peaks (MacDonald, C, Rocks to reactors: Uranium exploration and the market. Proceedings of WNA Symposium 2001). This initial cycle has provided more than enough uranium for the last three decades and several more to come. Clearly, it is premature to speak about long-term uranium scarcity when the entire nuclear industry is so young that only one cycle of resource replenishment has been required. It is instead a reassurance that this first cycle of exploration was capable of meeting the needs of more than half a century of nuclear energy demand.”
The article goes on to explain the difficulties inherent in trying to make any kind of accurate assessment of the planet’s total recoverable land-based uranium. Regardless, these numbers are in rough agreement with those cited by Prof. David MacKay in “Sustainable” power from nuclear fission. MacKay likes to normalize his units to the amount of energy consumed per day per person, kWh/d/p. Europeans consume an average of 125 kWh/d, Americans, twice this (250 kWh/d). This is total energy consumption from all sources: electric, gasoline, home and industrial heat, residential as well as commercial.
MacKay assumes a 6 billion person planet and estimates that the 4.5 billion tons uranium in seawater could, if burned in fast breeder reactors, provide each person with 420 kWh/d for a thousand years.26 Of course, since deep ocean water overturns only about once every 1600 years, it would not be possible to extract uranium this fast. But 420 kWh/d/p is at least three times as much total energy as any one person really needs, and after three thousand years one might hope humanity might unlock nuclear fusion or reduce its population to something less than a billion, or – who knows – even figure out how to use renewables effectively.
Lets depart the far future a moment and return to our present dillema.
In 2011 US electric consumption was 3,750,000 Gwh electric, for an average power of 430 GW electric or 1.3 TW thermal (at 33% efficiency).
The US has 63,000 tonnes of LWR spent fuel, increasing by 2 - 2.4 ktonnes annually Spent Fuel Storage.
The U.S. currently stores about 700,000 metric tons of depleted UF6, containing about 470,000 metric tons of uranium.
A fast reactor has a heavy metal burnup energy conversion of about 909 GW day/ton (GWd/t) or 2.5 GW year/ton (GWy/t or GWa/t). At current US average electric generation / consumption of 1.3 TW, this DU reserve would last us 2.5 GW a/t * 470,000 t / 1,300 GW = 900 years in fast reactors. The 63,000 tons of spent nuclear fuel could last another 100.
Then there is thorium, globally 3 to 4 times more abundant than uranium. And as with uranium, the earth’s total economically extractable thorium is not known. Estimates range up to 300 times the presently known 6 million tons, in which case thorium reactors could power 6 billion – should there still be that many of us – people at 120 kWh/d for 60,000 years.27
We’ll return to these numbers a bit later,
9 Light Water Reactor Safety: TMI, Chernobyl, Fukushima, and Generation III+ Reactors
9.1 Three Mile Island 1979
In 1979 what should have been a minor cooling malfunction ended up resulting in the partial core meltdown of Three Mile Island Unit 2 near Harrisburg, PA. The reactor was destroyed. Some radioactive gas was released several days after the initial accident. It was biologically inert (xenon-133, half-life 5 days) and there was not enough to cause any dose above background level. Chapter 6 of Prof. Bernard Cohen’s online book The Nuclear Energy Option gives an overview and history of safety considerations in commercial nuclear power, then details the accident at Three Mile Island. A more recent analysis is detailed at Three Mile Island Accident (March 2001, minor update Jan 2012):
More than a dozen major, independent studies have assessed the radiation releases and
possible effects on the people and the environment around TMI since the 1979 accident at
TMI-2. The most recent was a 13-year study on 32,000 people. None has found any adverse
health effects such as cancers which might be linked to the accident, beyond the initial stress.
What Happened:
- After shutting down the fission reaction, the TMI-2 reactor’s fuel core became uncovered and more than one third of the fuel melted.
- Inadequate instrumentation and training programs at the time hampered operators’ ability to respond to the accident.
- The accident was accompanied by communications problems that led to conflicting information available to the public, contributing to the public’s fears.
- The containment building worked as designed. Despite melting of about one-third of the fuel core, the reactor vessel itself maintained its integrity and contained the damaged fuel.
Longer-Term Impacts:
- Applying the accident’s lessons produced important, continuing improvement in the performance of all nuclear power plants.
- The accident fostered better understanding of fuel melting, including improbability of a “China Syndrome” meltdown breaching the reactor vessel and the containment structure.
- Public confidence in nuclear energy, particularly in USA, declined sharply following the Three Mile Island accident. It was a major cause of the decline in nuclear construction through the 1980s and 1990s.
In view of the looming climate catastrophe, the last cannot be over-emphasized. It shall be touched upon again in section 9.6.
9.2 Chernobyl 1986
Firstly, Chernobyl was most emphatically NOT a light-water reactor. Not in any conventional sense of the word. The RBMK-1000 was a water-cooled graphite-moderated boiling water design originally intended to simultaneously produce both electric power and weapons grade plutonium. This design would never have been implemented in the west. Nonetheless, it was implemented, and with catastrophic results. From Chernobyl Accident 1986 (Updated June 2013):
“The April 1986 disaster at the Chernobyl nuclear power plant in Ukraine was the product of a flawed Soviet reactor design coupled with serious mistakes made by the plant operators. It was a direct consequence of Cold War isolation and the resulting lack of any safety culture.”31
- The Chernobyl accident was the result of a flawed reactor design that was operated with inadequately trained personnel.
- The resulting steam explosion and fires released at least 5% of the radioactive reactor core into the atmosphere and downwind – some 5200 PBq (Iodine-131 eq).
- Two Chernobyl plant workers died on the night of the accident, and a further 28 people died within a few weeks as a result of acute radiation poisoning.
- UNSCEAR says that apart from increased thyroid cancers, “there is no evidence of a major public health impact attributable to radiation exposure 20 years after the accident.”
- Resettlement of areas from which people were relocated is ongoing.
“The Chernobyl disaster was a unique event and the only accident in the history of commercial nuclear power where radiation-related fatalities occurred. However, the design of the reactor is unique and the accident is thus of little (design and operating) relevance to the rest of the nuclear industry outside the then Eastern Bloc.”32
Which doesn’t mean Western reactor and safety specialists were not keenly interested in helping learn exactly what went wrong at Chernobyl Unit 4, and why.33 Detailed discussions of the accident are given at both links. However, apart from the “apart from increased thyroid cancers” part, it looks, if not promising, then at least not as bad as one might have thought. Unless one were one of those with an “increased thyroid cancer”. So what is the epidemiology? What are the odds?
Briefly: 31 deaths as immediate result of the hydrogen explosions (3) and acute radiation poisoning to emergency responders (28). Of the affected civilian population (who received much lower radiation doses) there have been 9 confirmed thyroid cancer deaths. That does not tell the whole story. An additional 4,000 civilian cancer deaths might accumulate over the years as result of radiation received from Chernobyl. Or they might not: there is a very large civilian population, and it will be difficult (or impossible) to distinguish Chernobyl-caused cancers, should any occur, from the much larger number of “naturally” occuring background cancers. Doesn’t mean such cancers might not or will not happen, just that we may not be able to distinguish them if they do.34
This is important stuff, as illustrated by Pandora’s charged exchanges with Physicians for
Social Responsibility co-founder Dr. Helen Caldicott. We cite Health Impacts: Chernobyl
Accident Appendix 2 (Updated November 2009), and reproduce its first section summarizing the
2006 World Health Organization report in its entirety.
It cites the following authoritative
assessments:
- The 2006 report of the World Health Organization (WHO), Health Effects of the Chernobyl Accident and Special Health Care Programmes.
- Exposures and effects of the Chernobyl accident, Annex J of the 2000 Report of the United Nations Scientific Committee on the Effects of Atomic Radiation to the General Assembly.
- Estimated Long Term Health Effects of the Chernobyl Accident, Background Paper 3 of the April 1996 conference in Vienna, One Decade After Chernobyl.
- Lessons of Chernobyl - with particular reference to thyroid cancer by Zbigniew Jaworowski, former chairman of the United Nations Scientific Committee on the Effects of Atomic Radiation.
Number of deaths
Apart from the initial 31 deaths (two from the explosions, one reportedly from coronary thrombosis (heart attack), and 28 firemen and plant personnel from acute radiation syndrome), the number of deaths resulting from the accident is unclear and a subject of considerable controversy. According to the 2006 report of the UN Chernobyl Forum’s Health Expert Group : “The actual number of deaths caused by this accident is unlikely ever to be precisely known.”
On the number of deaths due to acute radiation syndrome (ARS), the Expert Group report states: “Among the 134 emergency workers involved in the immediate mitigation of the Chernobyl accident, severely exposed workers and fireman during the first days, 28 persons died in 1986 due to ARS, and 19 more persons died in 1987-2004 from different causes.” Among the general population affected by the Chernobyl radioactive fallout, the much lower exposures meant that ARS cases did not occur.
Studies have been carried out to estimate the number of other fatalities amongst the emergency workers as well as the population of the contaminated areas.
Regarding the emergency workers with doses lower than those causing ARS symptoms, the Expert Group report referred to studies carried out on 61,000 emergency Russian workers where a total of 4995 deaths from this group were recorded during 1991-1998. “The number of deaths in Russian emergency workers attributable to radiation caused by solid neoplasms and circulatory system diseases can be estimated to be about 116 and 100 cases respectively.” Furthermore, “the number of leukaemia cases attributable to radiation in this cohort can be estimated to be about 30.” Thus, 4.6% of the number of deaths in this group are attributable to radiation-induced diseases. (The estimated average external dose for this group was 107 mSv.) From this study, it could be possible to arrive at an estimate of the mortality rate attributable to Chernobyl radiation for the rest of the Russian emergency workers (192,000 persons), as well as for the Belarusian and Ukrainian emergency workers (74,000 and 291,000 persons, respectively). Such estimates, however, have not yet been made and would depend on several assumptions, including that the age, gender and dose distributions are similar in these groups.
(Note: the preceding paragraph could better clarify where those 61,000 Russian emergency workers actually worked, and where they might or might not have been exposed.)
The picture is even more unclear for the populations of the areas affected by the Chernobyl fallout. However, the report does link the accident to an increase in thyroid cancer in children: “During 1992-2000, in Belarus, Russia and Ukraine, about 4000 cases of thyroid cancer were diagnosed in children and adolescents (0-18 years), of which about 3000 occurred in the age group of 0-14 years. For 1152 thyroid cancer patient cases diagnosed among Chernobyl children in Belarus during 1986-2002, the survival rate is 98.8%. Eight patients died due to progression of their thyroid cancer and six children died from other causes. One patient with thyroid cancer died in Russia.” It is from this that several reports give a figure of around nine thyroid cancer deaths resulting from the accident. It should also be noted that other statistics quoted in the Expert Group report give the total number of thyroid cancer cases among those exposed under the age of 18 as over 4800, though this does not affect the general point that “a large proportion of the thyroid cancer fatalities can be attributed to radiation.”
Regarding other effects, the Expert Group report states: “There is little peer-reviewed scientific evidence showing an increase above the spontaneous levels from cancer, leukaemia, or non-cancer mortality in populations of the areas affected by the Chernobyl fallout.” It does point out a study that reports an annual death rate of 18.5 per 1000 persons for the population living in Ukrainian areas contaminated with radionuclides, compared with 16.5 per 1000 for the 50 million population of Ukraine. “The reason for the difference is not clear, and without specific knowledge of the age and sex distributions of the two populations, no conclusion can be drawn.”
Current risk models are derived from studies of atomic bomb survivors, without adjustments for the protracted dose rates or allowances for differing background cancer incidence rates and demographics in the Chernobyl exposed populations. Based on these models, “a radiation related increase of total cancer morbidity and mortality above the spontaneous level by about 1-1.5% for the whole district and by about 4-6% in its most contaminated villages” can be estimated. The report continues: “The predicted lifetime excess cancer and leukaemia deaths for 200,000 liquidators, 135,000 evacuees from the 30 km zone, 270,000 residents of the SCZs [’strict control zones’] were 2200 for liquidators, 160 for evacuees, and 1600 among residents of the SCZs. This total, about 4000 deaths projected over the lifetimes of the some 600,000 persons most affected by the accident, is a small proportion of the total cancer deaths from all causes that can be expected to occur in this population. It must be stressed that this estimate is bounded by large uncertainties.”
Beyond this, “for the further population of more than 6,000,000 persons in other contaminated areas, the projected number of deaths was about 5000. This latter estimate is particularly uncertain, as it is based on an average dose of just 7 mSv, which differs very little from natural background radiation levels.” There is good reason to be sceptical of such a projection on the basis of the known or assumed doses.
The report emphasises that considerable uncertainty surrounds such projections. “Because of the uncertainty of epidemiological model parameters, predictions of future mortality or morbidity based on the recent post-Chernobyl studies should be made with special caution. Significant non-radiation related reduction in the average lifespan in the three countries over the past 15 years remains a significant impediment to detecting any effect of radiation on both general and cancer morbidity and mortality.”
Resettlement of contaminated areas
In the last two decades there has been some resettlement of the areas evacuated in 1986 and subsequently. Recently the main resettlement project has been in Belarus...
Protective measures will be put in place for 498 settlements in the contaminated areas where average radiation dose may exceed 1 mSv per year. There are also 1904 villages with annual average effective doses from the pollution between 0.1 mSv and 1 mSv. The goal for these areas is to allow their re-use with minimal restrictions, although already radiation doses there from the caesium are lower than background levels anywhere in the world. The most affected settlements are to be tackled first, around 2011 - 2013, with the rest coming back in around 2014 - 2015.
From Fact Sheet on Biological Effects of Radiation:
“About half of the total annual average U.S. individual’s radiation exposure comes from natural sources. The other half is mostly from diagnostic medical procedures. The average annual radiation exposure from natural sources is about 310 millirem (3.1 millisieverts or mSv). Radon and thoron gases account for two-thirds of this exposure, while cosmic, terrestrial, and internal radiation account for the remainder. No adverse health effects have been discerned from doses arising from these levels of natural radiation exposure.”
Similar estimates may be found at Radiation Information Network’s Radiation and Risk. The Belarus government and Pandora’s Promise producers appear to have their facts right. The 1 mSv/yr contamination radiation limit used by Belarus is one third the average U.S. background. As shown in Table 1 below, the resulting total 4 mSv/yr is also considerably less than background in many other parts of the world.
9.3 Fukushima Daiichi 2011
The 13 meter (42 ft) tsunami swept through Tokyo Electric Power Company’s woefully unprepared Daiichi Nuclear Power Station in Fukushima Prefecture, knocking out power lines, and disabling cooling systems and all emergency power. Some 160,000 people were ordered to evacute the vicinity from fear of radiation release from the stricken power reactors.
9.3.1 The Radiation Release
It was for good reason that Mr. Stone spent the Pandora’s Promise sequences measuring radiation levels around the striken Fukushima Daiichi plant. People are rightfully frightened whenever their local power plant explodes, and although “it has only happened twice”, it seems the most spectactular power plant suicides have been nuclear: Chernobyl in 1986 and again at Fukushima Daiichi in March 2011. Ionizing radiation is invisible, and we have an instinctive fear of hidden dangers we cannot see.
But here again Mr. Stone is absolutely correct: the actual danger posed to the public by the radiation released at Fukushima has been minimal. That does not mean there never was cause for alarm: the Japanese government ordered evacuation from the 10 km zone in the early morning of 12 March when it became clear there was emminent danger of hydrogen explosion at Unit 1, and expanded the zone to 20 km after the hydrogen buildup on the service floor did indeed explode.35 There was no way of knowing beforehand how bad such explosions would be, nor the total radiation release.
We review the film’s look at Japanese government policy and present radiation levels.
The standard physical unit of radiation is the Becquerel (Bq), where 1 Bq corresponds to 1 disintegration per second. It does not account for the size of the radioactive mass undergoing decay, nor the energy or penetrability of the radiation. These effects are approximately accounted for in the Sievert (Sv), the standard measure for biological radiation effect. One Sv is actually fairly hazardous; one thousandth this amount, the millisievert (mSv) is usually used.
In the immediate aftermath of the tsunami, the Japanese governments decided to evacuate people living in areas that might receive radiation levels higher than 20 mSv/yr. A line had to be drawn somewhere. The following table gives some context:
| 2.4 mSv/yr | Typical background radiation experienced by everyone (average 1.5 mSv in Australia, 3 mSv in North America). |
| 1.5 to 2.5 mSv/yr | Average dose to Australian uranium miners and US nuclear industry workers, above background and medical. |
| Up to 5 mSv/yr | Typical incremental dose for aircrew in middle latitudes. |
| 9 mSv/yr | Exposure by airline crew flying the New York Tokyo polar route. |
| 10 mSv/yr | Maximum actual dose to Australian uranium miners. |
| 10 mSv | Effective dose from abdomen & pelvis CT scan. |
| 20 mSv/yr | Current limit (averaged) for nuclear industry employees and uranium miners. |
| 50 mSv/yr | Former routine limit for nuclear industry employees. It is also the dose rate which arises from natural background levels in several places in Iran, India and Europe. |
| 50 mSv | Allowable short-term dose for emergency workers (IAEA). |
| 100 mSv | Lowest level at which increase in cancer risk is evident (UNSCEAR). Above this, the probability of cancer occurrence (rather than the severity) is assumed to increase with dose. Allowable short-term dose for emergency workers taking vital remedial actions (IAEA). |
| 170 mSv/wk | 7-day provisionally safe level for public after radiological incident, measured 1 m above contaminated ground (IAEA). |
| 220 mSv/yr | Long-term safe level for public after radiological incident, measured 1 m above contaminated ground. No hazards to health below this (IAEA). |
| 250 mSv | Allowable short-term dose for workers controlling the 2011 Fukushima accident. |
| 250 mSv/yr | Natural background level at Ramsar in Iran, with no identified health effects. (Some exposures reach 700 mSv/yr.) |
| 350 mSv/lifetime | Criterion for relocating people after Chernobyl accident. |
| 500 mSv | Allowable short-term dose for emergency workers taking life-saving actions (IAEA). |
| 680 mSv/yr | Tolerance dose level allowable to 1955 (assuming gamma, X-ray and beta radiation). |
| 700 mSv/yr | Suggested threshold for maintaining evacuation after nuclear accident. (IAEA has 880 mSv/yr over one month as provisionally safe. |
| 800 mSv/yr | Highest level of natural background radiation recorded, on a Brazilian beach. |
| 1,000 mSv short-term | Assumed to be likely to cause a fatal cancer many years later in about 5 of every 100 persons exposed to it (i.e. if the normal incidence of fatal cancer were 25%, this dose would increase it to 30%). |
| 1,000 mSv short-term | Causes (temporary) radiation sickness (Acute Radiation Syndrome) such as nausea and decreased white blood cell count, but not death. Above this, severity of illness increases with dose. |
| 5,000 mSv short-term | Would kill about half those receiving it within a month. (However, this is only twice a typical daily therapeutic dose applied to a very small area of the body over 4 to 6 weeks or so.) |
| 10,000 mSv short-term | Fatal within a few weeks. |
Thus the Japanese government’s decision to evacuate people living in areas that might be higher than
20 mSv/yr and to not let them return (with some flexibility) until radiation drops beneath that level
appears to be based on 20 mSv being roughly 10 times the 2 mSv/yr background radiation typical in
Japan. As we saw in the Chernobyl section, background levels in the U.S. average about 3.1 mSv/yr. From
the above table, 20 mSv/yr is less than half (40%) the background radiation level in some parts of Iran,
India, and Europe. It is one eleventh the 220 mSv/yr public limit assigned by IAEA, and one twelveth the
background level in Ramsar, Iran. The Pandora’s Promise measurements of current (2012)
radiation levels near Fukeshima Daiichi were probably accurate, and some might suggest the
Japanese government is being unduly cautious. But that is what they are elected for. The Linear
No-Threshold Hypothesis
From Nuclear Radiation and Health Effects: Low-level radiation
risks:
“Much research has been undertaken on the effects of low-level radiation. Many of the findings have failed to support the so-called linear no-threshold (LNT) hypothesis, which assumes the demonstrated relationships between radiation dose and adverse effects at high levels of exposure also applies to low levels and provides the (deliberately conservative) basis of occupational health and other radiation protection standards. Increasing evidence suggests there may be threshold below which no harmful effects of radiation occur. However, this is not yet accepted by national or international radiation protection bodies as sufficiently well-proven to be taken into official standards.”
A primary literature reference is Feinendegen et al. Hormesis by Low Dose Radiation Effects: Low-Dose Cancer Risk Modeling Must Recognize Up-Regulation of Protection (Therapeutic Nuclear Medicine Springer 2012 ISBN 978-3-540-36718-5), which concludes:
“Current radiogenic cancer epidemiology reports cannot overcome their statistical constraints and these papers do not assure the validity of the LNT-hypothesis at low doses. In fact, the LNT-hypothesis is inconsistent with many experiments, both in the laboratory and in the human exposure realms...
“The actual observed cancer risk of low-dose radiation appears to express the balance between cancer induction and cancer prevention by metabolic-dynamic defenses through prompt and adaptive protections. The consequences of these experimental findings are not contradicted by epidemiological data on radiation-induced cancer from low doses...
“Radiation biology has advanced to provide data that justify the rejection of the validity of the LNT-hypothesis also in concepts of collective dose or collective effective dose for predicting cancer risks of single, chronic, or repetitive low-level exposures...
“Frequently voiced arguments that the new low-dose experimental data are either irrelevant, or questionable, or irreproducible are not in line with scientific methodology.”
Interestingly, the authors argue that low-level radiation exposure, in addition to directly inducing correspondingly low-incidence of cancers as predicted by LNT-hypotheses, also prompts several biological defence and repair mechanisms that help reduce, contain, and eliminate some cancers – not only some of those directly induced from the low-level radiation itself, but also some spontaneously occuring cancers of unrelated cause as well. The net result at radiation exposures less than approximately the 100 mSv level, is a small net decrease in overall cancer incidence, rather than the small increase predicted by LNT-hypothesis alone. I am in no position to evaluate and by no means endorse this suggestion. These results are put forth by skilled professionals and are highly controversial. DO NOT attempt their replication at home!
For more on LNT-hypothesis and related regulations, please visit Radiation and Reason and scroll to “Download Recent Articles”. Prof Allison’s Radiation and nuclear technology: Safety without science is dangerous is a readable opinion piece; others are scholarly but still quite readable. Leslie Corrice cites over a dozen additional scholarly references in his readable Radiation : The No-Safe-Level Myth.
As of August 2013, there is concern about radiation being leaked to the sea. There is an estimate of 300 or 400 tonnes contaminated ground water each day, most of which is captured and placed in storage tanks. 300 tonnes in itself isn’t but a drop in the ocean and doesn’t mean much without the associated number of Curie or Bq of which radioisotopes. That information will undoubtedly be forthcoming, along with associated radiotoxicity.36 From Concrete Actions to Address the Contaminated Water Issue at Fukushima Daiichi NPS (11 Sept 2013):
- Influence of contaminated water is limited in the port of Fukushima Daiichi NPS, whose area is smaller than 0.3 km2 .
- The results of monitoring of sea water in Japan are consistantly below the standard of 10 Bq/L (“Guidelines for Radioactive Substances in Bathing Areas” released by Ministry of Environment gives an instruction regarding the water quality for municipalities to open bathing areas as follows; the concentration of radioactive Cs (Cs-134 and Cs-137) is lower than or equal to 10 Bq/L.)
- The temperature in the reactors ranges from 25 to 50 C for the last one month (as of August 29).
- The radioactive material release from the reactor buildings is evaluated at becquerels per cm3 for both Cs-134 and Cs-137.
- The radiation dose due to the radioactive material release is 0.03 mSv per year at the site boundaries, which is equivalent to 1/70 of annual natural radiation dose (Japan’s average is 2.1 mSv per year).
From Current Information on Radioactivity in Seawater as of 24 September 2013, the highest levels detected at reactor outlet ports was 5 Bq/l (combined Cs-137 and tritium) on Sept 16. See FAQ:Radiation from Fukushima for more on the sea-water controvery.
Update November 6: Tepco has opted for high-efficiency ion-exchange resin technology in its Advanced Liquid Processing System (ALPS), which will remove every radioisotope from the Fukushima-Daiichi storage tanks save tritium, which is part of the water itself. The left-over resin will be managed like other solid radioactive waste. Removing the tritium from the water molecules would be very hard, incredibly expensive, and totally unnecessary. At 6 kev tritium is one of the weakest beta emitters known, with half-life of 12 years. Tritium levels at Fukushima-Daiichi are estimated at 630 kBq/l and at that level are essentially harmless even if ingested. However to meet standards, after the other isotopes are separated, the remaining purified tritiated water will nonetheless be diluted 12 fold before release to the Pacific. Details at Fukushima Commentary. Mr. Corrice’s Fukushima and the Inevitable Tritium Controversy was added October 25, scroll down beneath “October 27, 2013” until you find it.
Let’s return to the situation inland:
“Monitoring beyond the 20 km evacuation radius to 13 April 2011 showed one location – around Iitate – with up to 0.266 mSv/day dose rate, but elsewhere no more than one-tenth of this. At the end of July 2011 the highest level measured within 30km radius was 0.84 mSv/day at a hotspot in Namie town, 24 km away. The safety limit set by the central government in mid-April for public recreation areas was 3.8 microsieverts per hour (0.09 mSv/day).”37
Now 0.266 mSv/day is 97 mSv/y and 0.84 mSv/day is 307 mSv/y. From table 1 we see 50 mSv/y is natural background in several areas of Iran, India, and Europe, while 220 mSv/y is the long-term safe level for public exposure as set by IAEA (International Atomic Energy Agency). Namie was definitely punching above that limit, and the government was fully justified in being cautious and carefully locating the few hotspots before allowing evacuees to return. By March 2013 maximum Namie radiation appears to have subsided beneath 184 mSv/yr (Figure 2).
From Fukushima Accident 2011 (updated July 2013):
Epidemiology of Radiation
We need some epidemiological context: “the World Health
Organisation (WHO) considered the health risk to the most exposed people possible: a postulated
girl under one year of age living in Iitate or Namie that did not evacuate and continued life
as normal for four months after the accident. Such a child’s theoretical risk of developing
breast cancer by age 89 would be increased from 29.04% to 30.20%, according to WHO’s
analysis.”
Four months is not a year, of course, only 1/3. And UNSCEAR lists 100 mSv/y as the lowest level at which increase in cancer risk becomes evident. So yes, locate these isolated hotspots and remediate. Until then one may visit, but don’t actually live there.
Overall, however, media response is typically overblown. Sex sells. So does horror. But consider:
“France’s Institute for Radiological Protection & Nuclear Safety (IRSN) estimated that maximum external doses to people living around the plant were unlikely to exceed 30 mSv/yr in the first year. This was based on airborne measurements between 30 March and 4 April 2011... It compares with natural background levels mostly 2-3 mSv/yr, but ranging up to 50 mSv/yr elsewhere.”
This is consistent with the maps in Figure 1.
Epidemiology of Evacuation Stress
“As of October 2012, over 1000 disaster-related deaths that were
not due to radiation-induced damage or to the earthquake or to the tsunami had been identified by the
Reconstruction Agency, based on data for areas evacuated for no other reason than the nuclear accident.
About 90% of deaths were for persons above 66 years of age. Of these, about 70% occurred within the
first three months of the evacuations. (A similar number of deaths occurred among evacuees from
tsunami- and earthquake-affected prefectures. These figures are additional to the 19,000 that died in the
actual tsunami.)
“The premature deaths were mainly related to the following: (1) somatic effects and spiritual fatigue brought on by having to reside in shelters; (2) Transfer trauma – the mental or physical burden of the forced move from their homes for fragile individuals; and (3) delays in obtaining needed medical support because of the enormous destruction caused by the earthquake and tsunami. However, the radiation levels in most of the evacuated areas were not greater than the natural radiation levels in high background areas elsewhere in the world where no adverse health effect is evident, so maintaining the evacuation beyond a precautionary few days was evidently the main disaster in relation to human fatalities.”38
Radiation exposure beyond the plant site
“On 4 April 2011, radiation levels of 0.06 mSv/day were
recorded in Fukushima city, 65 km northwest of the plant, about 60 times higher than normal but posing
no health risk according to authorities. Monitoring beyond the 20 km evacuation radius to 13 April
showed one location – around Iitate – with up to 0.266 mSv/day dose rate, but elsewhere
no more than one-tenth of this. At the end of July the highest level measured within 30km
radius was 0.84 mSv/day in Namie town, 24 km away. The safety limit set by the central
government in mid-April for public recreation areas was 3.8 microsieverts per hour (0.09
mSv/day).
“In June 2013, analysis from Japan’s Nuclear Regulation Authority (NRA) showed that the most contaminated areas in the Fukushima evacuation zone had reduced in size by three-quarters over the previous two years. The area subject to high dose rates (over 166 mSv/yr) diminished from 27% of the 1117 k zone to 6% over 15 months to March 2013, and in the ‘no residence’ portion (originally 83-166 mSv/yr) no areas remained at this level and 70% was below 33 mSv/yr. The least-contaminated area is now entirely below 33 mSv/yr.
“In May 2013, the UN Scientific Committee on the Effects of Atomic Radiation (UNSCEAR) reported, following a detailed study by 80 international experts. It concluded that ”Radiation exposure following the nuclear accident at Fukushima Daiichi did not cause any immediate health effects. It is unlikely to be able to attribute any health effects in the future among the general public and the vast majority of workers.” The only exception are the 146 emergency workers that received radiation doses of over 100 mSv during the crisis. They will be monitored closely for “potential late radiation-related health effects at an individual level.”
“By contrast, the public was exposed to 10-50 times less radiation. Most Japanese people were exposed to additional radiation amounting to less than the typical natural background level of 2.1 mSv per year.
“People living in Fukushima prefecture are expected to be exposed to around 10 mSv over their entire lifetimes, while for those living further away the dose would be 0.2 mSv per year. The UNSCEAR conclusion reinforces the findings of several international reports to date, including one from the World Health Organisation (WHO) that considered the health risk to the most exposed people possible: a postulated girl under one year of age living in Iitate or Namie that did not evacuate and continued life as normal for four months after the accident. Such a child’s theoretical risk of developing breast cancer by age 89 would be increased from 29.04% to 30.20%, according to WHO’s analysis.
UNSCEAR’s report “will be the most comprehensive international scientific analysis of the information available to date” when published in full later in 2013 at the UN General Assembly.
Summary: “There have been no harmful effects from radiation on local people, nor any doses approaching harmful levels. However, some 160,000 people were evacuated from their homes and only in 2012 were allowed limited return... As of October 2012, over 1000 disaster-related deaths that were not due to radiation-induced damage or to the earthquake or to the tsunami had been identified by the Reconstruction Agency, based on data for areas evacuated for no other reason than the nuclear accident. About 90% of deaths were for persons above 66 years of age. Of these, about 70% occurred within the first three months of the evacuations. (A similar number of deaths occurred among evacuees from tsunami- and earthquake-affected prefectures. These figures are additional to the 19,000 that died in the actual tsunami.)”39
The casualties from the Fukushima evacuation itself exceeds 5% the total 19,000 who lost their lives across Japan as direct result of the earthquake and tsunami. This raises a few questions:
- Given the extreme stress of the situation at the Fukushima-Daiichi nuclear station (and rapid deterioration of Unit 1 in particular), could the plant operators or government consultants have given the government a realistic upper bound to the radiation expected to be released by the impending hydrogen explosions?
- Mass evacutions have mass casualty statistics of their own. By how much could the Fukushima casualties have been reduced had mass evacuation not been ordered 12 March 2011, in favor of orders for people to remain indoors until radiation teams could map the radiation release and assess more precisely just which hot-spots should be evacuated?
- In hindsight the mass evacutation appears to have been unneccessary. Could it have been seen to be so in foresight?
- Given that mass evacuation was ordered, by how much could the Fukushima casualties have been reduced had the majority of evacuees been allowed to return to their homes in a timely fashion?
“It is important to understand that the risk to health from radiation from Fukushima
is negligible, and that undue concern over any possible health effects could be much
worse than the radiation itself.”
–Gerry Thomas, Imperial College, London, in Fear and Fukushima.
9.3.2 What Happened
From the WNA’s description of the Fukushima Accident:
“The Great East Japan Earthquake of magnitude 9.0 at 2.46 pm on Friday 11 March 2011 did considerable regional damage, and the large tsunami it created caused very much more...
“Eleven reactors at four nuclear power plants in the region were operating at the time and all shut down automatically when the quake hit. Subsequent inspection showed no significant damage to any from the earthquake. The operating units which shut down were Tokyo Electric Power Company’s (Tepco) Fukushima Daiichi 1, 2, 3, and Fukushima Daini 1, 2, 3, 4, Tohoku’s Onagawa 1, 2, 3, and Japco’s Tokai, total 9377 MWe net. Fukushima Daiichi units 4, 5 & 6 were not operating at the time, but were affected. The main problem initially centred on Fukushima Daiichi units 1-3. Unit 4 became a problem on day five.
“The reactors proved robust seismically, but vulnerable to the tsunami. Power, from grid or backup generators, was available to run the Residual Heat Removal (RHR) system cooling pumps at eight of the eleven units, and despite some problems they achieved ‘cold shutdown’ within about four days. The other three, at Fukushima Daiichi, lost power at 3.42 pm, almost an hour after the quake, when the entire site was flooded by the 15-metre tsunami. This disabled 12 of 13 back-up generators on site and also the heat exchangers for dumping reactor waste heat and decay heat to the sea. The three units lost the ability to maintain proper reactor cooling and water circulation functions. Electrical switchgear was also disabled. Thereafter, many weeks of focused work centred on restoring heat removal from the reactors and coping with overheated spent fuel ponds.
- The accident was rated 7 on the 0-7 INES scale, due to high radioactive releases over days 4 to 6, eventually a total of some 940 PBq (Iodine-131 eq).40
- Four reactors are written off – 2719 MWe net.
- After two weeks the three reactors (units 1-3) were stable with water addition but no proper heat sink for removal of decay heat from fuel. By July they were being cooled with recycled water from the new treatment plant. Reactor temperatures had fallen to below 80C at the end of October, and official ‘cold shutdown condition’ was announced in mid December.
- Apart from cooling, the basic ongoing task was to prevent release of radioactive materials, particularly in contaminated water leaked from the three units. As of August 2013, there is increasing concern about radiation being leaked to the sea.
- There have been no deaths or cases of radiation sickness from the nuclear accident, but over 100,000 people were evacuated from their homes to ensure this.”
Whether or not it was ever necessary to evacuate that many people (or for how long) is a matter of ongoing debate. But faced with inadequate information and deteriorating conditions, such was the governmental perception at the time. See Fukushima’s Worst-Case Scenarios: Much of what you’ve heard about the nuclear accident is wrong, and a Roger Clifton comment on some findings in Mark Willacy’s Fukushima. 41
![[Picture]](../img/fukushima_radioactivity_2011_and_2012.png "click to enlarge")
![[Picture]](../img/NamieTownRadiation3.1.13.jpg "click to enlarge")
Sources: Fukushima Accident 2011 and Radiation In Namie Town, Japan, Almost 2 Years After Fukushima Meltdowns. Multiply uSv/h by 8.77 to get mSv/y. 20 mSv/y is 2.3 uSv/h. (Left) Maps from MEXT aerial surveys carried out approximately one year apart show the reduction in contamination from late 2011 to late 2012. Areas with colour changes in 2012 showed approximately half the contamination as surveyed in 2011, the difference coming from decay of caesium-134 (two year half-life) and natural processes like wind and rain. In blue areas, ambient radiation is very similar to global background levels at 0.5uSv/h which is equal to 4.38 mSv/y. The red areas are those bumping up against the Japanese government’s 20 mSv/y evacutation limit. (Right) There remain isolated hotspots in Namie (24 km NW of Fukushima Daiichi) that still reach nine times that amount (21 uSv/h = 184 mSv/y). IAEA lists 220 mSv/y as the long-term safe level for public after a radiological incident. Others have suggested five times this amount as a more realistic safe limit.42 Compare with Table 1.
9.3.3 And Why
The nuclear consequence of the Great East Japan Earthquake of 2011 is well described in the above WNA link. It was not pretty. The World Nuclear Association article is dispassionate, objective, and does not assign blame. Of which there is plenty. Given the very public concern about the ongoing situation at Fukushima Daiichi, it is worth mentioning results of both Japan’s own investigation, and international review. A concise overview is given by Fukushima a disaster ’Made in Japan’, with the sordid details exposed at Why Fukushima Was Preventable.
Make no mistake: Fukushima Daiichi was not a random “Act of God” that could not be defended against. Yes, the GE-Hitachi boiling water reactors there were of a 1960’s design housed in the earliest Mark-I iteration of its containment structure. But that wasn’t the problem. By best estimation, although “The earthquake that preceded the tsunami exceeded the seismic design basis of the plant at units 2, 3, and 5. TEPCO and NISA (the Nuclear and Industrial Safety Agency) have stated that no critical safety-related equipment – such as emergency diesel generators, seawater pumps, and cooling systems – was damaged in the earthquake, although it seems that this claim cannot be conclusively verified until the plant can be inspected much more closely than is currently possible. Though the tsunami led to most – if not all – of the damage, the underestimation of the seismic hazard provides evidence of systemic problems in disaster prediction and management.”43
It is telling that Tokyo Electric Power Company’s Fukushima Daiichi unit was not the nuclear power installation subject to the greatest tsunami energy after the Great East Japan Earthquake. That dubious distinction goes to Tohoku Electric’s Onagawa plant, 120 km (75 mi) to the north:44
“In 1979, the Tohoku Electric Power Company relocated the site for its three-unit Onagawa Nuclear Power Station prior to construction in light of tsunami concerns. The March 2011 earthquake and tsunami devastated the town of Onagawa, located about 75 miles north of Fukushima. The event knocked out four of five power lines connecting the power station to the grid. Unlike at Fukushima Daiichi, where turbine buildings hosting emergency diesel generators suffered a direct assault from the tsunami, the Onagawa station was better protected. According to Japanese safety officials and the plant owner, it escaped serious damage because prior to construction, a civil engineer employed by the owning utility company, having personal local knowledge of tsunami dangers, insisted that the plant site be moved to higher ground and farther back from the seacoast.”
It’s not certain that is quite how it finally played out, as it seems there was a compromise whereby the plant retained its original site, but the seawall was increased to 14 m (46 ft) from its original 3.1. The tsunami of 11 March 2011 was 13 m at both Onagawa and Fukushima Daiichi. But the latter’s seawall was only 5.7 m:45
“The Fukushima accident was, however, preventable. Had the plant’s owner, Tokyo Electric Power Company (TEPCO), and Japan’s regulator, the Nuclear and Industrial Safety Agency (NISA), followed international best practices and standards, it is conceivable that they would have predicted the possibility of the plant being struck by a massive tsunami. The plant would have withstood the tsunami had its design previously been upgraded in accordance with state-of-the-art safety approaches...
“Steps that could have prevented a major accident in the event that the plant was inundated by a massive tsunami, such as the one that struck the plant in March 2011, include:
- Protecting emergency power supplies, including diesel generators and batteries, by moving them to higher ground or by placing them in watertight bunkers;
- Establishing watertight connections between emergency power supplies and key safety systems; and
- Enhancing the protection of seawater pumps (which were used to transfer heat from the plant to the ocean and to cool diesel generators) and/or constructing a backup means to dissipate heat.
“Though there is no single reason for TEPCO and NISA’s failure to follow international best practices and standards, a number of potential underlying causes can be identified. NISA lacked independence from both the government agencies responsible for promoting nuclear power and also from industry. In the Japanese nuclear industry, there has been a focus on seismic safety to the exclusion of other possible risks. Bureaucratic and professional stovepiping made nuclear officials unwilling to take advice from experts outside of the field. Those nuclear professionals also may have failed to effectively utilize local knowledge. And, perhaps most importantly, many believed that a severe accident was simply impossible.
“In the final analysis, the Fukushima accident does not reveal a previously unknown fatal flaw associated with nuclear power. Rather, it underscores the importance of periodically reevaluating plant safety in light of dynamic external threats and of evolving best practices, as well as the need for an effective regulator to oversee this process.”46
Emphasis added. As we saw in section 9.2, even knowing it was possible, the USSR State Committee
for the Supervision of Safety in Industry and Nuclear Power (SCSSINP) didn’t believe an
explosive instability would ever actually arise at an operating RBMK-1000 power station.
9.3.4 U.S. Industry Response
Nuclear power plant operators across the globe closely watched Fukushima unfold. Thorough safety reviews were instigated at all 104 U.S. power reactors within days. The Nuclear Energy Institute summarize their findings in Safety: US Nuclear Energy Industry Responds to Accident in Japan. Key actions include:
- Acquiring additional safety backup systems, including diesel genrators and pumps.
- Increasing ability of nuclear facilities to remain safe in the face of extended loss of electric power.
- Improvements to ensure accessible and reliable hardened vents for Mark I and Mark II boiling water reactor containments, thus removing heat and maintaining of pressure control during an extended loss of off-site power. Of America’s 104 reactors, 31 have Mark I or Mark II containments. (Mark I containments were used at Fukushima. Failure of their emergency vent systems during extended station blackout allowed hydrogen to accumulate on the service floors of Units 1, 2, and 3. The hydrogen subsequently exploded, blowing the roofs off the containment buildings and releasing significant radiation off-site.)
- Improve plants’ ability to monitor water level and temperature in used fuel storage pools during an extended loss of electric power.
- Assess emergency communications and equipment to ensure that power is maintained during a large-scale natural event.
9.4 A Nuclear Reactor is not an Atomic Bomb
It isn’t. Alarmist propaganda not withstanding, a nuclear reactor cannot “Blow up like an atom bomb!!!” It just can’t. From Highly Enriched Uranium we find the minimum uranium enrichment for unmoderated criticality is 6%. Commerical light-water nuclear fuels are usually enriched to between 2% and 5% – but no higher for just this reason. From Fuel Fabrication Safety Considerations:
“... fuel fabrication facilities operate with a strict limitation on the enrichment level of uranium that is handled in the plant – this cannot be higher than 5% U-235, essentially eliminating the possibility of inadvertent criticality.”
Of course, a nuclear reactor has to become critical in order to produce power. But criticality is designed in through use of a moderator, and the moderator – whatever it is – promotes fission so strongly that any combination of feul elements that should fall together in an extreme accident (as may have happened at Chernobyl after steam explosions destroyed their support matrix) will either overheat and slow the reaction, or violently blow themselves apart (with comparatively modest energy) long before a moderated critical mass can either accumulate or be substantially irradiated.
Here “long” is a relative term measuring a few to a few hundred microseconds.
Low uranium enrichment and moderation are just two of the myriad major differences between a nuclear reactor and an atomic bomb, but they alone are sufficient to guarantee the impossibility of a power reactor “blowing up like an atom bomb”.
Those who have read on the history of the Manhattan Project are well aware that atomic bombs do not just fall together. To get the high explosive yield obtained by fissioning a substantial fraction of the critical mass of uranium in the bomb requires careful fabrication of an explosive mechanism that can rapidly assemble pieces of the critical mass of metal into a critically dense configuration before energy from prompt fast neutron fissions can blow them back apart. The explosive mechanism may be either the “simple” gun arrangement used in uranium bombs, or the considerably more sophisticated implosion devices used with plutonium.
Considering just the uranium gun assembler, the arrangement traditionally consists of a thick doughnut “ring” of highly enriched weapons-grade uranium, and a spike of similar metal to be fired into the doughnut hole. Individually, neither the dougnut nor the spike make a critical mass, but together they do. The trick is to first get them together before the dougnut can reject the spike in a very low-yield explosion, then get them to stay together long enough for the chain reaction to sufficiently build to fission a substantial portion of the mass before it can similarly blow itself apart with very low yield.
These are bomb design considerations. Uranium has a small enough fast neutron fission cross-section that a gun mechanism may assemble the highly enriched parts before the reaction builds sufficiently to prevent insertion of the spike, after which the reaction might build rapidly enough to sufficiently irradiate the entire mass with a high fast neutron flux while it is still inertially confined. Its a good trick if you can do it, and as for moderation, to quote Werner Heisenberg “One can never make an explosive with slow neutrons, not even with the heavy water machine, as then the neutrons only go with thermal speed, with the result that the reaction is so slow that the thing explodes sooner, before the reaction is complete.”47
The first explosion at Chernobyl was a steam explosion similar to a boiler explosion at a fossil fuel plant. Subsequent explosions are usually attributed either to steam, hydrogen generated by reaction of steam with zirconium feul-rod cladding, or perhaps carbon-monoxide and hydrogen from a hot-fuel driven reaction of graphite moderator with steam. Whatever their source, the explosions at Chernobyl pale to insignificance beside that of a real nuclear weapon. See Willacy’s Fukushima.
9.5 Risk in Perspective: Power-related Safety by Energy Source
| Energy Source | Death Rate (deaths per TWh |
| Coal (elect, heat,cook - world avg) | 100 (26% of world energy, 50% of electricity) |
| Coal electricity world avg | 60 (26% of world energy, 50% of electricity) |
| Coal (elect,heat,cook) - China | 170 |
| Coal electricity - China | 90 |
| Coal - USA | 15 |
| Oil | 36 (36% of world energy) |
| Natural Gas | 4 (21% of world energy) |
| Biofuel/Biomass | 12 |
| Peat | 12 |
| Solar (rooftop) | 0.44 (0.2% of world energy for all solar) |
| Wind | 0.15 (1.6% of world energy) |
| Hydro | 0.10 (europe death rate, 2.2% of world energy) |
| Hydro - world including Banqiao) | 1.4 (about 2500 TWh/yr and 171,000 Banqiao dead) |
| Nuclear - including Chernobyl | 0.04 (5.9% of world energy) |
9.5.1 Risks of Nuclear Energy in Perspective
Prof Bernard Cohen was a radiation physicist. Not surprisingly, he had a few words to share in Understanding Risk
“If we compare these risks with some of those listed in Table 1, we see that having a full nuclear power program in this country would present the same added health risk (Union of Concerned Scientists estimates in brackets) as a regular smoker indulging in one extra cigarette every 15 years [every 3 months], or as an overweight person increasing her weight by 0.012 [0.8] ounces, or as in raising the U.S. highway speed limit from 55 miles per hour to 55.006 [55.4] miles per hour, and it is 2,000 [30] times less of a danger than switching from midsize to small cars. Note that these figures are not controversial, because I have given not only the estimates of Establishment scientists but also those of the leading nuclear power opposition group in this country, UCS.
“It seems to me that these comparisons are the all-important bottom line in the nuclear debates. Nuclear power was rejected because it was viewed as being too risky, but the best way for a person to understand a risk is to compare it with other risks with which that person is familiar. These comparisons are therefore the best way for members of the public to understand the risks of nuclear power. All of the endless technical facts thrown at them are unimportant and unnecessary if they only understand these few simple risk comparisons. That is all they really need to know about nuclear power. But somehow they are never told these facts. The media never present them, and even nuclear advocates hardly ever quote them.”
Fukushima isn’t going to change this any. Prof Cohen’s chapter is well-worth reading. Prof Wade Allison provides topical insight and analysis at Radiation and Reason – scroll to “Download Recent Articles” – and is currently active in the field. Also see Karen Street’s well documented and poignant essay Earthquake, Tsunami, and Nuclear Power in Japan: The Ocean of Light above the Ocean of Darkness.
9.6 Generation III+ Light-Water Reactor Designs
It is important to realise the context of the origins of Gen III+ designs. Though its actual danger was minimal, the implications and effects of TMI on the nuclear industry were profound and cannot be understated. A good overview is given in Searching for Safety, part of the 1997 PBS series Nuclear Reaction: Why do Americans Fear Nuclear Power?. Though initially “cheaper than coal” in the 1970’s, the combined result of the industry’s re-thinking, and increased NRC regulations and public mistrust, was an over ten-fold increase in nuclear power plant costs over a period of just a few years.51
A brief overview of safety considerations in modern reactor design is given in Chapter 10 of Prof. Bernard Cohen’s The Nuclear Energy Option. The basic idea for both new pressurized (PWR) and boiling water (BWR) designs is to replace pump-based cooling circulation with natural convection, and to provide large amounts of gravity-flow and pre-pressurised redundant cooling water that may keep the reactor core and containment safely cool for at least three days in case of complete power loss such as happened at Fukushima. Allowance is made for ease-of-replacement of cooling water in such an emergency. (These designs predate Fukushima by over a decade.) A second consideration is simplification and standardization of design. Apart from their reactor vessels and cores, nuclear plants built during the 1960’s and ’70’s tended to each be a one-off, which eventually lead to regulatory and licensing delays, and massive cost over-runs during the 1980’s. The industry hopes pre-approved standard designs will promote predictable licensing times and construction costs.
In addition, most modern light-water designs are, like fast reactors, load following. Many existing reactors are as well. Rather than being able to supply just baseload, they may change power output rapidly enough to follow minute-to-minute changes in power demand from the grid – an increasingly important consideration in the face of deepening penetration of intermitent renewables. Such considerations are featured in each of the following:
- AP1000: Advanced Passive 1000, Westinghouse. China has 12 units planned, four under
construction with operation scheduled for 2014-15. U.S. has two under construction at Georgia
Power’s Vogtle site and SCE&G’s V.C. Summer station. An AP1000 overview and design
safety are given by Westinghouse in AP1000 Probabilistic Risk Assessment (PRA) estimates
CDF (Core Damage Frequency) of
per plant per year, and LRF (Large Release Frequency) of
per plant per year (page 6).
Load following: “The plant is designed to accept a step-load increase or decrease of 10 percent between 25 and 100 percent power without reactor trip or steam-dump system actuation... Further, the AP1000 is designed to accept a 100 percent load rejection from full power to house loads without a reactor trip or operation of the pressurizer or steam generator safety valves.” From Responding to System Demand, apparently quoting unspecified Westinghouse specs; these are allowed and exceed typical EU requirement for new plant.
- ESBWR: Economically Simplified Boiling Water Reactor, GE-Hitachi. This large (1520
MWe) design awaits final NRC rule issuance.
Next-generation nuclear energy: The ESBWR Focuses on simplicity and safety.
Boiling Water Reactors are inherently load-following: see Nuclear Power Reactors and ESBWR Overview: ABWR Evolutionary Safety Improvement; ESBWR Improving Safety Passively page 3. But unlike GEH’s ABWR, ESBWR will not normally be expected to operate in a load-following mode because of its size.52
- EPR: European Pressurized Reactor, Areva. Two under construction in Finland and France, another two in China. European units face costly delays; Chinese units on schedule for operation in 2014.
- ATMEA I: Areva-Mitsubishi. Also see ATMEA1. Passed first stage of Candian regulatory approval July 2013. Turkey has accepted a bid of four 1.1 GW units for $22 billion.
And a few Generation IV fast designs:
- PRISM Integral Fast Reactor: GE-Hitachi. This is Gen IV, not III+, and a sodium cooled fast reactor, not light water. Link provides contains numerous references, as does Cost Comparison of IFR and Thermal Reactors – the last of a 4-part IFR series. No PRISM have yet been built, or are under construction. However, GEH have bid a two-unit system in a proposal to burn Britain’s accumulated plutonium surplus.
- EM2 – GT-MHR. The EM2 Energy Multiplier Module is a modified version of General Atomic’s
Gas-Turbine Modular Helium Reactor. It is a Gen IV Small Modular Reactor proposed as a
candidate for the US DoE SMR funding program. Fuel cycle is similar to IFR – PRISM, though
reprocessing would be done at a central factory location rather than onsite as befits the SMR
concept. Interment time for final waste remains about 300 years. From General Atomics in contest
for SMR funds:
“The EM2 employs a 500 MWt, 265 MWe helium-cooled fast-neutron high-temperature reactor operating at 850C. This would be factory manufactured and transported to the plant site by truck. According to GA, the EM2 reactor would be fuelled with 20 tonnes of used PWR fuel or depleted uranium, plus 22 tonnes of uranium enriched to about 12% U-235 as the starter.
“It is designed to operate for 30 years without requiring refuelling. Used fuel from the EM2 could be processed to remove fission products (about 4 tonnes) and the balance then recycled as fuel for subsequent cycles, each time topped up with four tonnes of used PWR fuel. The module also incorporates a truck-transportable high-speed gas turbine generator.”
EM2 passive safety is obtained via high-temperature ceramic fuel cladding, together with low fuel density and high thermal conductivity of the support matrix, which combined may safely withstand residual decay heat even in case of complete coolant loss. High-pressure helium gas is the combined coolant, moderator, and working fluid for the turbine, and cannot itself become radioactive. As with all commercial reactors, EM2 operates with a negative thermal coefficient: heating the helium reduces its neutron moderation, slowing the reaction; substantial loss stops the reaction. Core expansion contributes: fast neutron reactors must operate at very high neutron flux just to maintain criticality; excessive thermal expansion of the core fuel rods and support matrix rapidly decreases the neutron density beneath criticality and stabilizes the reaction.
The EM2 reactor module runs at an impressive 850 Deg C, resulting in turbine thermal efficiency of nearly 50% and making the system suitable for producing process heat for the chemical industry, including hydrogen production for transportation.
9.6.1 Load Following
![[Picture]](../img/3regimesDemandBaseloadBalanced.gif "click to enlarge")
It actually gets quite a bit more complicated: this is but the first figure from The 3-part view of power generation.
From Responding to System Demand:
“Significant discussions have occurred recently on various internet venues about ‘load following’ – that is, the capability of a generating source to adjust its power output to match variable demands. There is a myth spreading that nuclear power plants cannot load follow, and today’s ever-changing discussion about low-GHG generating sources demands that this myth be dispelled.”
While true, the above assertion is not without qualification. The 3-part view of power generation gives a concise illustrated description of electric power variation, load demands, and resulting load following requirements. As do thermal fossil plants, commercial nuclear power plants usually have a design minimum power floor beneath which they typically may not operate without shutdown. (AP1000 may be an exception, but still has a nominal 25% load floor during normal operation.) Also, high initial finance and construction costs, and comparatively low fuel costs encourage baseload full-power operation of nuclear plant whenever possible. Cost per MWh generated, which is what you bill for, is minimized that way. Thus from the second ATMEA1 link under ”Load-follow requirements”, we find in daily operation ATMEA1 operates with a power floor of 25%, from which it is capable of rapid return to full power without notice at a rate of 5% per minute.
Atmea1’s load following figures are similar to currently operating French PWR’s,53 which isn’t surprising as its a French design. Atmea1 is nominally a 1 GW plant, so 5% per minute corresponds to 50 MW per minute. 5% per minute is also a rate typical for fossil (e.g. natural gas) plants, which themselves have minimum partial loads of 30% - 50%, for which there are both emissions and efficiency penalties. Xcel Energy has some PC (Pulverized Coal) plants with a “hibernation” mode capable of turning down from 250 MW to 25 MW, still burning coal. (See Impact of Load Following on Power Plant Cost and Performance, Exhibit 1.) Cold start time for NGCC is given as “150 to 250 min with new technology, 100 starts/yr”
That last “100 starts/yr” limitation reflects a common weakness of all thermal plants: thermal stress. Rapid load fluctuations over a significant portion of a plant’s operating range can strain many elements of the heat transfer and steam system, including the steam generators in nuclear plants. Parts wear out faster and need to be replaced. This costs downtime and money. For this reason load following specifications often consider two modes of operation. The first is slow variation through large power swings in the intermediate load regime, where a plant might be specified as capable of swinging through 25% to 100% of rated power, provided such large swings are smoothly timed over an interval of perhaps half a day to follow diurnal load variation.
The second load following mode provides peaker capability through smaller but more rapid load swings. Here a plant may follow rapid fluctuations of perhaps 5% around 95% of its rated power, resulting in a 10% total fluctuation, as opposed to 75% in the smoothly varying intermediate regime, and thereby reduce the thermal strain. Different plants complement each other by operating in different modes.
Rapid load fluctuations on a fossil plant introduce thermal (fuel) inefficiency and emissions problems as well.
It should be noted that some older nuclear plants might not have load-following capability without upgrades to their control systems, which requires NRC approval. And while respectable and usually adequate, nuclear load following is not generally in the same class as hydro. Gas turbines – whether from natural gas or high-temperature Brayton cycle fast reactors – are better than steam. For more detailed discussion see Technical and Economic Aspects of Load Following with Nuclear Power Plants.
Part II
Pandora’s Purpose
In a word, Anthropogeneic Global Warming. The Earth is going to hell in a handbasket, and we are responsible. The process is not necessarily irreversible, but as we shall see in section 10.5.6 below, the amount of electric power needed to stabilize the climate this century will likely be over four times what the world consumes today. The population will grow. People will want energy abundant lives. And carbon dioxide emissions must cease. Realistically, that simply will not happen without both renewables and extensive global comittment to nuclear power.
10 But “real” renewables are here today, so why bother?
And nothing succeeds like “Success!!!” Perhaps the only serious shortcoming of Pandora’s Promise is its failure to make a cogent statement for the need for nuclear power. Mostly idle windmills aside, it is not an easy argument to make, particularly in the large and windy United States. Energy technology, grid engineering, and power economics are extremely complex, and there is a lot of optimistic misinformation being passed about, mostly sincerely, by those who sincerely believe wind, water, and solar (WWS) can do the job by themselves. Several questions:
- Just what is the job that must be done?
- Can renewables actually do it?
- How fast, and at what cost?
The job that must be done is the avertment of climate catastrophe. That is the singular goal that must be kept firmly in mind. Time is of the essence, and so is cost. Money is not unlimited, and when available at all, comes in incremental installments. The lower the cost of abating each ton of emitted CO2 or methane, the more that may be avoided, sooner. Safety is certainly a crucial consideration, as are reliability and cost. But the goal is rapid curtailment of greenhouse gasses.
The numbers are daunting. As mentioned above, the U.S. currently emits 5.3 billion metric tons CO2 each year into the atmosphere, of which over 2 billion tons are from electric power generation.54 Globally,
“CO2 emissions from fossil-fuel combustion reached a record high of 31.6 gigatonnes (Gt) in 2011. This represents an increase of 1.0 Gt on 2010, or 3.2%. Coal accounted for 45% of total energy-related CO2 emissions in 2011, followed by oil (35%) and natural gas (20%). The 450 (ppm) Scenario of the IEAs World Energy Outlook 2011, which sets out an energy pathway consistent with a 50% chance of limiting the increase in the average global temperature to 2 C, requires CO2 emissions to peak at 32.6 Gt no later than 2017, i.e. just 1.0 Gt above 2011 levels. The 450 Scenario sees a decoupling of CO2 emissions from global GDP, but much still needs to be done to reach that goal as the rate of growth in CO2 emissions in 2011 exceeded that of global GDP. ‘The new data provide further evidence that the door to a 2 C trajectory is about to close...’ ” 55
EIA estimates that about 10% of world marketed energy consumption is from renewable energy sources (hydropower, biomass, biofuels, wind, geothermal, and solar), with a projection of 14% by 2035. About 19% of world electricity generation is from renewable energy – 16% from hydro – with a projection of 23% in 2035.56 That 14% (23%) renewable penetration by 2035 is woefully inadequate, and does not in itself directly address the problem of ever-increasing fossil fuel consumption:
“The stark reality of the challenge at hand is that the global politics of climate change has stalled. Few countries are willing to make economic sacrifices to reduce their carbon emissions.57 Another reality is this: Coal is the source of nearly half the world’s energy (and) the trend will increase throughout the decade. According to IEA executive director Maria van der Hoeven, ‘the world will burn around 1.2 billion more tons of coal per year by 2017 compared to today – equivalent to the current coal consumption of Russia and the United States.’ ” From Nuclear Energy and Climate Change: Environmentalists Debate How to Stop Global Warming
And that mythical “2 Deg C Global Warming Limit”, representing an increase of atmospheric CO2 concentration from its pre-industrial value of 280 ppmv to 450 ppmv, is itself a recipe for disaster:
“James Hansen, director of the NASA Goddard Institute for Space Studies in New York, whose data since the 1980s has been central to setting the 2 degree benchmark, said today that two degrees is too much. The paleoclimate record shows that 560 ppm CO2 would be enough to melt all the ice in the Arctic, and later the Antarctic... once the Antarctic melts, sea levels would rise by 60 to 70 meters. If nations continue to emit CO2 at current rates, the world could reach 560 ppm by 2100.
‘If governments keep going the way they are going, the planet will reach an ice-free state.’
‘If the world begins reducing CO2 emissions by 6 percent a year starting in 2012’, Hansen said, atmospheric levels can return to the ‘safe’ level of 350 ppm that he and others have long called for. ‘If the world waits until 2020 to begin, it will need to reduce CO2 by 15 percent a year to reach 350 ppm. We are out of time.’ From 2-Degree Global Warming Limit Is Called a “Prescription for Disaster”
Out of time. We are currently at 400 ppmv CO2 and rising. 1 ppmv CO2 = 2.13 Gt carbon. 58 100 ppmv CO2 = 213 Gt carbon = 781 Gt CO2. At 32 Gt/y we’ll emit this amount and reach 500 ppm CO2 in 24.5 yrs. But the “450 Scenario” is half this: at our going rate 450 ppm CO2 will be reached in but 12 years. And we won’t be able to just shut it off like a faucet come 2025: we must start reductions now.59
The largest and most pressing problem is coal. How do we (global we) most rapidly and economically replace coal-fired electric generation with low-carbon equivalent? Massive increase in cost or decrease in reliability will not be acceptable, as those economic regions that accept either will be at severe economic disadvantage to those who do not. (Tragedy of the Commons.) Massive change in energy technology comes slowly. It takes several lifetimes to put a new energy system into place, and wishful thinking can’t speed things along. Vaclav Smil, in A Skeptic Looks at Alternative Energy and Can We Live again in 1964’s Energy World? writes:
“The ultimate justification for alternative energy centers on its mitigation of global warming: Using wind, solar, and biomass sources of energy adds less greenhouse gas to the atmosphere. But because greenhouse gases have global effects, the efficacy of this substitution must be judged on a global scale. And then we have to face the fact that the Western world’s wind and solar contributions to the reduction of carbon-dioxide emissions are being utterly swamped by the increased burning of coal in China and India.
“The numbers are sobering. Between 2004 and 2009 the United States added about 28 GW of wind turbines. That’s the equivalent of fewer than 10 GW of coal-fired capacity, given the very different load factors. During the same period China installed more than 30 times as much new coal-fired capacity in large central plants, facilities that have an expected life of at least 30 years. In 2010 alone China’s carbon-dioxide emissions increased by nearly 800 million metric tons, an equivalent of close to 15 percent of the U.S. total. In the same year the United States generated almost 95 terawatt-hours of electricity from wind, thus theoretically preventing the emission of only some 65 million tons of carbon dioxide. Furthermore, China is adding 200 GW of coal-fired plants by 2015, during which time the United States will add only about 30 GW of new wind capacity, equivalent to less than 15 GW of coal-fired generation. Of course, the rapid increase in the burning of Asian coal will eventually moderate, but even so, the concentration of carbon dioxide in the atmosphere cannot possibly stay below 450 ppm.
“Perhaps the most misunderstood aspect of energy transitions is their speed. Substituting one form of energy for another takes a long time. And turning around the worlds fossil-fuel-based energy system is a truly gargantuan task. That system now has an annual throughput of more than 7 billion metric tons of hard coal and lignite, about 4 billion metric tons of crude oil, and more than 3 trillion cubic meters of natural gas. This adds up to 14 trillion watts of power. And its infrastructure – coal mines, oil and gas fields, refineries, pipelines, trains, trucks, tankers, filling stations, power plants, transformers, transmission and distribution lines, and hundreds of millions of gasoline, kerosene, diesel, and fuel oil engines – constitutes the costliest and most extensive set of installations, networks, and machines that the world has ever built, one that has taken generations and tens of trillions of dollars to put in place.
“It is impossible to displace this supersystem in a decade or two – or five, for that matter. Replacing it with an equally extensive and reliable alternative based on renewable energy flows is a task that will require decades of expensive commitment. It is the work of generations of engineers.”
Nuclear is pretty much a drop-in replacement for coal, and it is coal that must most immediately be dropped-out and replaced. As an example, Germany embarked upon Energy Change in 2011 and hopes to generate 80% of its electricity from renewables (wind, solar, hydro, and biofuel) by 2050, roughly forty years. In contrast, France currently gets 12% of its electricity from hydro,60 and 78.8% from her 59 nuclear plants, 56 of which were built in just the fifteen year period between 1975 and 1990.61 In the process, Germany’s electricity prices have become second highest in Europe, 40% higher than in France.62 Progress is intermittent,63 and the environmental cost is staggering.64
10.1 But I Have a Dream...
“A dream of windmills and solar farms from here to as far as the eye can see, hydro on every stream, and vast tracts of arable land expropriated to indefinitely sustainable bio-mass production, all seemlessly interconnected by a vast glittering web of vitally redundant high-voltage transmission lines that reliably shuttle intermittent electric power back and forth across the land from wherever it is to wherever it is needed, all backed and balanced by clean, environmentally friendly, emissions-free natural gas.” –From “The Great Green Dream”.
Alternatively, Pandora’s promise is of but a few appropriately-sized nuclear plants optimally placed near major centers of consumption, with no more redundancy than necessary to cover scheduled (and unscheduled) down-time and maintenance. But nukes don’t come exactly cheap,65 and their cost has risen rather disconcertingly over time.66 Money is jobs, low cost energy is economic competitiveness. Which approach is lowest cost? Can they be effectively combined?
10.2 But the Wind Always Blows...
“The wind always blows somewhere. Build enough windmills everywhere and everyone will have a share.” Or that’s the theory. But there is no free lunch, or energy either: each windmill costs something and has a finite lifetime. How much overbuild will a given economic region require to provide requisite amounts of “free” energy, and how much will it cost? Wind is not necessarily an unlimited resource. How much of the demand should be met by solar? Of which varieties? How much additional hydro is available, and how much can the wind and solar overbuild – and associated new transmission – be decreased with hydro balancing and backup? How much more may the overbuild be decreased with fossil fuel backup, gas and coal?
The last is a critical question, because it turns out the wind doesn’t necessarily “always blow somewhere”, and as we saw in MarginalUtility, certainly not “always somewhere” on scales of less than 1000 km. If we are to place a firm absolute cap on carbon emissions, then baring a highly effective carbon capture and sequestration system, any dependence on fossil fuel backup of necessity places an absolute cap on the amount of energy an economic region (and its populace) may generate and use.
Proponents argue such energy impoverishment may be minimized with suitably draconian demand management67 (sometimes euphemistically termed “demand side participation”), which will require some sort of “smart grid” that can dictate who gets how much energy, when, and at what price. We should welcome our smart new overlords, though I’ll personally feel better about the proposition should I have some assurance they will actually have sufficient energy to meter out. Then its just a matter of how much one wants to pay, and when. But any long-term requirement of fossil-fuel backup and balancing, simultaneous with a strict cap on carbon emission, does not lend encouragement in that regard.
And it is carbon emissions that must be the bottom line. Lowest short-term costs and greatest short-term economic competitiveness are obtained from business as usual: but if we continue to burn coal like there’s no tomorrow, there won’t be.
No. The only questions that matters are “How do we reduce carbon emissions rapidly enough to save the planet from catastrophic global warming?” What is the most economical way to meet that number one goal while still maintaining economic competiveness relative to the rest of the world? Can we develop and deploy such technologies cheaper than coal? Can the rest of the world use them?
10.3 But It’s a Global Problem...
| Estimated levelized cost of new generation resources, 2018
| ||||||
| U.S. average levelized costs (2011 $/MWh) for plants entering service in 2018
| ||||||
| Plant type | Capacity factor % | Levelized capital cost | Fixed O&M | Variable O&M including fuel | Transmission investment | Total system levelized cost |
| Dispatchable Technologies | ||||||
| Conventional Coal | 85 | 65.7 | 4.1 | 29.2 | 1.2 | 100.1 |
| Advanced Coal | 85 | 84.4 | 6.8 | 30.7 | 1.2 | 123.0 |
| Adv. Coal + CCS | 85 | 88.4 | 8.8 | 37.2 | 1.2 | 135.5 |
| Natural Gas-fired | ||||||
| Combined Cycle | 87 | 15.8 | 1.7 | 48.4 | 1.2 | 67.1 |
| Advanced CC | 87 | 17.4 | 2.0 | 45.0 | 1.2 | 65.6 |
| Adv. CC + CCS | 87 | 34.0 | 4.1 | 54.1 | 1.2 | 93.4 |
| OCGT | 30 | 44.2 | 2.7 | 80.0 | 3.4 | 130.3 |
| Adv. OCGT | 30 | 30.4 | 2.6 | 68.2 | 3.4 | 104.6 |
| Adv. Nuclear | 90 | 83.4 | 11.6 | 12.3 | 1.1 | 108.4 |
| Geothermal | 92 | 76.2 | 12.0 | 0.0 | 1.4 | 89.6 |
| Biomass | 83 | 53.2 | 14.3 | 42.3 | 1.2 | 111.0 |
| Non-Dispatchable Technologies | ||||||
| Wind | 34 | 70.3 | 13.1 | 0.0 | 3.2 | 86.6 |
| Wind-Offshore | 37 | 193.4 | 22.4 | 0.0 | 5.7 | 221.5 |
| Solar PV | 25 | 130.4 | 9.9 | 0.0 | 4.0 | 144.3 |
| Solar Thermal | 20 | 214.2 | 41.4 | 0.0 | 5.9 | 261.5 |
| Hydro | 52 | 78.1 | 4.1 | 6.1 | 2.0 | 90.3 |
Regional variation in levelized cost of new generation resources entering service 2018
| |||
| Range of total system levelized costs (2011 $/MWh)
| |||
| Plant type | Minimum | Average | Maximum |
| Dispatchable Technologies | |||
| Conventional Coal | 89.5 | 100.1 | 118.3 |
| Advanced Coal | 112.6 | 123.0 | 137.9 |
| Advanced Coal with CCS | 123.9 | 135.5 | 152.7 |
| Natural Gas-fired | |||
| Conventional Combined Cycle | 62.5 | 67.1 | 78.2 |
| Advanced Combined Cycle | 60.0 | 65.6 | 76.1 |
| Advanced CC with CCS | 87.4 | 93.4 | 107.5 |
| Conventional Combustion Turbine | 104.0 | 130.3 | 149.8 |
| Advanced Combustion Turbine | 90.3 | 104.6 | 119.0 |
| Advanced Nuclear | 104.4 | 108.4 | 115.3 |
| Geothermal | 81.4 | 89.6 | 100.3 |
| Biomass | 98.0 | 111.0 | 130.8 |
| Non-Dispatchable Technologies | |||
| Wind | 73.5 | 86.6 | 99.8 |
| Wind-Offshore | 183.0 | 221.5 | 294.7 |
| Solar PV | 112.5 | 144.3 | 224.4 |
| Solar Thermal | 190.2 | 261.5 | 417.6 |
| Hydro | 58.4 | 90.3 | 149.2 |
It cannot be overstressed that these levelized costs are marginal costs – the projected 2018 cost of adding a single MWh of each technology to the grid as it existed in 2011 – and may be deceiving when one attempts to scale current levelized cost of renewables to total usable electric costs in scenarios of substantial market penetration. At low penetration levels, each small increment of even intermittent power may be usefully absorbed by the grid. But it doesn’t scale; at some point intermittency and capacity factor begin to matter. In Renewables: The 99.9% solution, Budischak et al. estimate a minimal electric price of 26¢/kWh ($260/MWh) in a PJM Interconnect model obtaining 99.9% of its power from renewables, mostly wind. Here is a (seemingly) clear case where, if external climate costs were to exclude fossil sources of generation, classical marginal market economics would favor wind and hydro as their immediate replacement, even though eventual cost at the desired low-carbon goal, $260/MWh, rises to well over twice that of nuclear.
At low penetration levels the low cost of intermittent rewables is both a blessing and a curse, exacerbated by the particular methods we have chosen to subsidise them.70 Though subsidized differently, cheap natural gas has a similar effect. Low cost of lower carbon sources is fine when they displace high-carbon coal. But when they deplace even lower-carbon nuclear, their environmental benefit becomes less clear. From Nuclear Power Fracked Off:
“The culprit is the price of natural gas, which fell from over $13 per million British thermal units in 2008, when many of the applications to build new nuclear plants were lodged, to just $2 last year. Although it has since recovered to over $4, America’s huge reserves of shale gas should stop it from rising much for years to come. That makes some old nuclear plants costlier to run than gas-fired ones. Factoring in the massive expense of building new reactors – the pair (being built by Southern Co.) at Vogtle in Georgia will cost around $15 billion – makes nuclear power even less competitive. David Crane, boss of NRG Energy, which scrapped plans to build two reactors in Texas in 2011, estimates that new gas-fired generation costs 4¢ per kilowatt-hour, against at least 10¢ for nuclear...
“Southern shrugs. Over a 40- or 60-year lifespan, it says, the (Vogtle) plant is the best option for customers. They will be insulated from the gyrations of the natural-gas price, immune from new rules to curb fossil fuels and spared the intermittency of solar and wind power. The firm can already borrow cheaply, thanks to its heft and regulations that allow it to charge captive customers for all ‘reasonable’ expenses, plus a fixed profit margin.”
But by way of comparison, a recent Delaware renewables study (Budischak et al. see below) estimates “for 90 percent (renewable penetration), the cost jumps to 19¢/kWh best case (which uses hydrogen storage), while the cost for 99.9 percent coverage rises to a best case (using vehicle storage) of 26¢/kWh. These rates include the cost of procuring and installing the energy infrastructure in the first place.” As at present neither hydrogen nor electric vehicles offer practical grid storage, the study has a certain amount of built-in optimism. Back at the oranges, from figure 4 below we see 2013 rates top out at 9¢/kWh in Texas, so if NRG couldn’t bring nuclear power in for less than 10¢/kWh (roughly speaking), it would lose money. But some new nuclear power is still being built. Noteably by Southern Co. at their Vogtle plant in Georgia, where we see 2013 rates topping out at 11.24¢/kWh. That isn’t much of a margin, but Southern has a sweetheart deal with the local PUC, and think they can afford to be in it for the long haul.
And over the long haul, its that 99.9% renewables coverage that counts, as any residual is covered by fossil fuel backup and even 10% can’t be squandered on electric: it will be needed for process and transportation. So: 11¢ to 13¢/kWh for nuclear vs. 26¢/kWh for renewables would look like a no-brainer, were “all us or all them” not still the wrong question:
“Globally, how do we most rapidly and economically curtail emission of greenhouse gas?”
Because while it may look like nuclear is the clear winner and renewables should pack their tent and go home, time is of the essence, and it is only so fast that any technology can be deployed. As Prof. Smil explained, replacing our global fossil fuel infrastructure is a monumental undertaking. And even pristine nukes have their opponents.
A rough nuclear-is-half-the-cost-of-renewable for large grid penetration argument has also been made for Australia, albeit with considerably more rigor: see Section 10.5.3 below.
![[Picture]](../img/average_retail_revenues.png "click to enlarge")
But see Michael Bluejay’s How much electricity costs, and how they charge you for some important caveats.
10.4 But What About China...
What about China? And India and Pakistan as well. China is at last beginning to take its coal addiction seriously. Although it still accounted for 59% of China’s newly-added capacity in 2012, coal use in China is reaching its peak.71 From Nuclear Power in China:
- Mainland China has 17 nuclear power reactors in operation, 28 under construction, and more about to start construction.
- Additional reactors are planned, including some of the world’s most advanced, to give a four-fold increase in nuclear capacity to at least 58 GWe by 2020, then possibly 200 GWe by 2030, and 400 GWe by 2050.
- China has become largely self-sufficient in reactor design and construction, as well as other aspects of the fuel cycle, but is making full use of western technology while adapting and improving it.
- China’s policy is for closed fuel cycle.
The United States currently has about 100 commerical power reactors. China is working with Westinghouse to increase AP1000 from its nominal 1.1 GW to 1.4 GW and then 1.7 GW. China will have the intellectual property rights to manufacture and market them itself. Advanced reactors + closed fuel cycle means fast neutron reactors.72 And where is America? Our public refusal to recognize the necessity and benefits of nuclear power does not mean the rest of the world will. “American leadership” is predicated on the assumption America actually leads. Thus far we have lead the world in safety of reactor design and operation. The lessons of TMI were hard learned, but they were learned – and much cheaper than they might have been. America’s resulting nuclear safety culture is second to none, and if we wish to see it shared by the rest of the world, we must participate in solutions to the rest of the world’s problems. Climate change is a global problem. In the context of waste management alone, the President’s Blue Ribbon Commission on America’s Nuclear Future concludes
“Put simply, this nations failure to come to grips with the nuclear waste issue has already proved damaging and costly and it will be more damaging and more costly the longer it continues: damaging to prospects for maintaining a potentially important energy supply option for the future, damaging to state-federal relations and public confidence in the federal government’s competence, and damaging to America’s standing in the world – not only as a source of nuclear technology and policy expertise but as a leader on global issues of nuclear safety, non-proliferation, and security.”73
Emphasis added. You don’t play the game, you don’t make the rules. Or even influence them.74 The world won’t stop just because America wants to get off.
10.5 But Renewable Economic Models Look So Good...
Not really. My search has hardly been exhaustive, but the three renewable modeling studies I have found look positively spin. Each starts with the proposition that their selected grid is candidate for all-renewables electricity generation, then proceeds to find a least-cost mixture of wind, sun, energy storage, and fossil backup and carbon tax that meets a desired emissions goal. Each also makes the explicit assumption that nuclear is a Really Bad Thing to be avoided at all costs. Which is a Good Thing, as the final costs they come up with may exceed EIA nuclear estimates 1.5 to 3 times.
Such studies are useful in the sense they place a dollars-and-cents ballpark around the price of avoiding nuclear. To the extent they minimize the serious infrastructure and market changes actually required, allowing casual readers to lull themselves a false sense an “all renewables all the time” solution is realistically feasible, they are perhaps a bit less so. In the interest of balanced reporting I’ll also discuss three additional studies that forgo the rose-coloured glasses in favour of the bean-counter’s green eyeshades.75 The last of these, “RCP4.5: Pathway for Stabilization of Radiative Forcing by 2100” (section 10.5.6) is truely cost-minimizing, and includes all available technology options that can cost-effectively contribute to mitigation. In the least-cost solutions, nuclear ends up playing a dominant role.
We’ll consider a few fundamentals and a few constraints, then the models:
“The market” finds a local minimum to an optimization problem. The problem it solves is finding the most efficient (lowest cost) production and distribution of goods and services, subject to various constraints. In absence of any constraints on CO2 emission or fossil fuel production, and but $10/ton coal76 and gas less than $5/MMBtu77 in the cost function, its little wonder the optimal solution the market finds does not significantly reduce U.S. GHG emissions (if it reduces them at all). Wind and Solar PTC (Production Tax Credit) lowers cost of wind and solar relative to fossil fuels and nuclear, and promotes growth of the wind and solar industries, but has at best a secondary effect on CO2.78
From Is the US Exporting Coal Pollution?:
“Figures released earlier this month by the U.S. Energy Information Administration show U.S. coal exports reached a record of more than 115 million tons in 2012, more than double the 2009 figure. EIA figures show Europe is now by far the biggest customer for U.S. coal, importing more than all other markets combined. U.S. exports to the UK jumped by about 70 percent in 2012. Exports to Germany, which phased out nuclear power generation in response to the Fukushima accident in Japan, have also increased.
“A recent report from the UK’s Tyndall Centre for Climate Change Research looked at the growth of the shale gas industry in the United States and questioned whether it had contributed to a global drop in CO2 emissions.
“The answer was no: Tyndall’s calculations suggest that more than half of the emissions avoided in the U.S. power sector – through the switch from coal to gas – may have been exported as coal.”
These findings are expanded in Coal: the Ignored Juggernaut:
“In the same way that falling US oil consumption has freed up global supply, so now is US declining coal demand freeing up production for export:
“For the full year of 2011, the US exported 107,259 thousand short tons of coal. This was the highest level of coal exports since 1991. More impressive: exports recorded a more than 25% leap compared to the previous year, 2010. Additionally, this was also a dramatic breakout in volume from the previous decade, which ranged from 40,000 – 80,000 thousand short tons per annum.
“Coal is the preferred energy source of the developing world. In addition, as the Organisation for Economic Co-operation and Development (OECD) has shifted its manufacturing to the developing world over the past few decades, coal has been the cheap energy source that has powered the rise of such manufacturing, especially in Asia. Accordingly, the extraordinary increase in global coal consumption the past decade is partly due to the OECD offshoring its own industrial production. How are most consumer goods made? Using electricity in developing world manufacturing centers, generated by coal...”
For such reasons the modeling groups generally eschew government subsidies for all energy sources, and rely upon modeled carbon taxes to increase the relative costs of gas and coal.
Finally, there are a few questions about some basic physical assumptions underlying the economics of wind. The first is the “the wind always blows somewhere” myth widely known to be false by intermittant modeling groups and grid operators, but nonetheless occasionally still perpetuated by intermittent renewal proponents. As discussed in section 10.2, market penetration beyond the marginal low-penetration capacity factor of wind – about 33% in the United States – will of necessity require energy storage and/or demand management to absorb the windy day excess. That, or feather some of the turbines and forgo even more capacity factor and efficiency (which turns out to be cheaper). Either way, full demand-managed load storage and/or backup generation availability will be required at all times to fill in the calms, which will be stochastic in nature.
The second has to do with wind energy density. Most modeling studies – including the massive NREL undertaking discussed in section 10.5.5 – assume an average wind areal energy density of 4 or 5 W/. But from Are global wind power resource estimates overstated?
“Most estimates have implicitly assumed that extraction of wind energy does not alter
large-scale winds enough to significantly limit wind power production. Estimates that
ignore the effect of wind turbine drag on local winds have assumed that wind power
production of 2-4 W per square meter can be sustained over large areas. New results
from a mesoscale model suggest that wind power production is limited to about (0.5 to)
1 W per square meter at wind farm scales larger than about 100 k.”
‘If wind powers going to make a contribution to global energy requirements that’s serious, 10 or 20 percent or more, then it really has to contribute on the scale of terawatts in the next half-century or less,’ Keith adds. A terawatt (TW) is one trillion watts. In 2006 energy use worldwide amounted to about 16 TW.
‘Our findings don’t mean that we shouldn’t pursue wind power – wind is much better for the environment than conventional coal – but these geophysical limits may be meaningful if we really want to scale wind power up to supply a third, let’s say, of our primary energy... The real punch line is that if you can’t get much more than half a watt out, and you accept that you can’t put them everywhere, then you may start to reach a limit that matters.’
“To stabilize the climate, he estimates, the world will need to find sources for several tens of terawatts of carbon-free power within a human lifetime. Keith says: ‘It’s worth asking about the scalability of each potential energy source – whether it can supply, say, three terawatts, which would be 10 percent of our global energy need, or whether it’s more like 0.3 terawatts and 1 percent.’
‘Wind power is in a middle ground. It is still one of the most scalable renewables, but our research suggests that we will need to pay attention to its limits and climatic impacts if we try to scale it beyond a few terawatts.’79
This may be an important consideration for windfarm planning and spacing, as deep penetration models place optimal wind contribution at over 80%. However, with our large land area and relatively low population density this is probably not a fundamental limitation within the United States. But it may well be elsewhere, such as the geographically smaller and population dense United Kingdom. While by no means “one size fits all”, there must be viable low-carbon energy rich solutions for everyone.
10.5.1 The United States: PJM Interconnect Model 2012
“To evaluate high market penetration of renewable generation under a strong constraint of always keeping the lights on, we match actual PJM load with meteorological drivers of dispersed wind and solar generation (Fig. 1) for each of the 35,040 h during those four years. We created a new model named the Regional Renewable Electricity Economic Optimization Model (RREEOM). Our model is constrained (required) to satisfy electrical load entirely from renewable generation and storage, and finds the least cost mix that meets that constraint... we did not include how much additional transmission is optimum, or reliability issues not related to renewable resource fluctuations.”
- “Our model is constrained (required) to satisfy electrical load entirely from renewable generation and storage, and finds the least cost mix that meets that constraint” means just that: the least cost mix found was not necessarily the least cost mix had the “renewable generation and storage” constraint been relaxed to allow nuclear as well, including nuclear’s reduction of additional transmission requirements.
- “We match actual PJM load with meteorological drivers of dispersed wind and solar generation... during those four years (1999 - 2002)”, while certainly a good place to start, is not without limitations: (a) do those years represent the extreme lows in wind and solar output that might be expected over a longer (20 - 50) year period? (b) what is the effect of increasing wind generation penetration on decreasing wind density and output? (See Keith’s “Are global wind power resource estimates overstated?” above.) Will these results scale to estimated future power requirements, say 2050 and beyond? (c) Is it even possible to predict the effects of climate change on wind patterns and strength? And solar – will there be substantially increased midday cloud cover? In the absence of such meteorogical estimates, the author’s use of past data to predict future performance is as good as any and better than most. But it might not be realistic.
“A fourth option is to use existing fossil generation for backup. Although this reintroduces pollution into the system and can only produce to meet shortfall, not absorb excess electricity, it takes advantage of existing generation plants, thus costing only fuel and operations not new plant investment. We model fill-in power from fossil, not hydro or nuclear power. Hydropower makes the problem of high penetration renewables too easily solved, and little is available in many regions, including PJM. We do not simulate nuclear for backup because it cannot be ramped up and down quickly and its high capital costs make it economically inefficient for occasional use. For scenarios in which backup is used rarely and at moderate fractions of load, load curtailment is probably more sensible than fossil generation. This could be considered a fifth mechanism, but for simplicity we here conservatively do not assume load management but fill any remaining gaps of power with fossil generation.”
- Even pre-existing fossil plants must wear out sometime. Particularly if used in a rapid-ramp load-following capacity. There is also the question of what is the minimum load they must sustain – and consequent GHG emitted – to remain in effective standby mode. This will vary with technology, for CCGT it may be 30 - 50%, see section 9.6.1. Although I don’t have load-floor numbers for less efficient open-cycle gas generation, presumably they are better. There is the related question of how rapidly different fossil plants can be brought online from warm and cold starts, and the emission penalties for each. (The sources cited in section 9.6.1 suggest that at least for some gas plants cold-start is a viable option given the amount of rapid electrochemical backup assumed in the study, and improved wind forecasts.)
- “No nukes” is an artificial constraint. As seen in section 9.6.1, most modern Gen III+ and IV reactor designs have load following capability similar to or better than current fossil plants. Whether either technology can follow fast enough for a given grid scenario is a matter for modeling, not assumption. While true many 1970’s era Generation II reactor designs in current operation are pretty much baseload only, presumeably subtraction of such extremely low-carbon baseload should simplify the minimization of total CO2 emission. But that was not the problem addressed in this study.
- “High capital costs make (nuclear) economically inefficient for occasional use.” No argument there – but why would one wish to restrict such a reliable, inherently low-carbon technology to occasional use? And why allow existing fossil plants to contribute, and exclude existing nuclear? By arbitrarily making such restriction one has again constrained oneself into asking the wrong question. The question asked by Budischak et al. was “For the PJM Interconnect, what is the least-cost combination of wind power, solar power and electrochemical storage that will power the grid up to 99.9% of the time?” A more meaningful question, addressed in section 10.5.6, is “Globally, how do we most rapidly and efficiently reduce GHG emissions sufficient to avoid climate catastrophe?” They are different, and one shouldn’t confuse the two.
- I have no particular quarrel with their conservative decision to forgo considering demand (load) management. I doubt “real” conservatives will have much difficulty with it either. But it is artificial, and it is a constraint.
“When running the simulation, for each hour, weather is used to determine that hour’s power production. If renewable generation is insufficient for that hour’s load, storage is used first, then fossil generation. During times of excess renewable generation, we first fill storage, then use remaining excess electricity to displace natural gas. When load, storage and gas needs are all met, the excess electricity is “spilled” at zero value, e.g. by feathering turbine blades.
“In calculating the cost of each combination, we calculate true cost of electricity without subsidies. In the case of renewable generation, we exclude current subsidies from the Federal and State governments. For fossil power, we add in pollution’s external costs to third parties; these are not included in market price, but are borne by other parties such as taxpayers, health insurers, and individuals. Here they are included in the cost of electricity...”
Totally reasonable. PTC and feed-in tarrifs that artifically introduce negative energy costs grossly distort the energy market, and are a grid operator’s nightmare.81 However as of today (August 2013) there is no attempt in the U.S. to internize external fossil fuel costs. By doing so in their model, the author’s might shed some insight on the operation of any proposed carbon tax.
“For the cost of renewable energy and storage, we used published costs for 2008, and published projections for 2030, all in 2010 dollars. For example, projected capital costs for wind and solar in 2030 are roughly half of today’s capital costs but projected operations and maintenance (O&M) costs are about the same... The 2030 cost projections assume continuing technical improvements and scaleup, but no breakthroughs in renewable generation nor storage technologies. For fossil fuels, we use prices plus external costs today, without adjustments for future scarcity, pollution control requirements, nor fuel shifts... We do not include load growth because we are comparing the optimum point under differing cost parameters, not projecting to the power system of 2030. These assumptions have the advantage that simple and transparent inputs to a complex model make relationships clearer.”
The authors are clear about just what questions they are asking, and believe they have answered. Its a useful start and provides valuable insight. But again not exactly the problem that must be solved. The authors have provided a valuable tool and methodology that might be applied to the larger question. But load growth is a crucial consideration, as its not just today’s electric demand that must be replaced, but a larger-population future where electric power must be expected to provide a substantial portion of transportation and heating as well. The load might easily double, and there may be limits to available wind. The authors make assumptions about the availability of future storage tech – hydrogen and grid-connected EV’s – that may or may not be valid as well. I can’t comment on their fuel cell technology; they admit their GIV (grid-integrated vehicle) assumption – 100% the 2008 passenger vehicle fleet – is “optimistic”.82
“The costs being minimized included the expenses of financing, building and operating solar, wind and storage, expressed in cents per kWh delivered to load. The hours not covered by the system have an additional cost for fossil electricity; this is tabulated to compute cost per kWh but it was not part of the cost minimization algorithm.”
Note “the costs being minimized” include greenhouse gas emission internalized into the cost of fossil fuel. But due to plant limitations – load floor minimum, typically 30 to 50 percent – some fuel will be burnt whether you need the energy or not. So, what of the hours that are covered by the renewables system when the fossil backup is sitting as spinning reserve – spinning at minimum power (30%), presumably generating electricity – and emitting greenhouse gas? How much reserve is this? How much greenhouse gas? What role might forecasting play to reduce them?
“We simplify our grid model by assuming perfect transmission within PJM (sometimes called a “copper plate” assumption), and no transmission to adjacent grids. We also simplify by ignoring reserve requirements, within-hourly fluctuations and ramp rates; these would be easily covered with the amount of fast storage contemplated here. In addition, we assume no preloading of storage from fossil (based on forecasting) and no demand-side management. Adding transmission would raise the costs of the renewable systems calculated here, whereas using adjacent grids, demand management, and forecasting all would lower costs. We judge the latter factors substantially larger, and thus assert (without calculation) that the net effect of adding all these factors together would not raise the costs per kWh above those we calculate below.”
Somewhat more detailed analysis may be needed. In what ways might demand management lower net costs to the consumer? And forecasting will be absolutely necessary to meet our emissions goals (if we should have any) by powering off fossils (to the extent possible) during forecast periods of reliable wind. Germany has had an extremely frustrating experience trying to meet renewables’ increased cost of transmission, and adjacent grid operators are equally frustrated when forced to absorb the resulting overflow.83 Adding a nominal 1.5¢/kWh renewables transmission surcharge raises the 99.9% solution to 33.5¢/kWh (2008 prices), pushing to within shouting distance of Germany’s 34¢/kWh,84 triple an “overnight” estimate of electricity cost from nuclear (10.5¢/kWh). Using the author’s projected 2030 costs brings their 99.9% solution down to 18.5¢/kWh vs an EIA estimated 8.5¢/kWh for nuclear.85
Update Tables 4 and 5 reproduce Budischak et al. Tables 3 and 4. GIV are “Grid Integrated Vehicles” – electric vehicles and plug-in hybrids integrated into a smart grid. From Table 4 we see that in the 90% solution fossil generation accounts for 7% (2.18/31.5) of total power, while for 99.9% fossils contribute but 0.05%. The former may be acceptible, the latter certainly is. Again, the PJM modeling study did not include transmission costs, which have been estimated to add another 1.5¢/kWh to the cost of renewables. There are uncertainties involved in projecting future technology costs, particularly for electrochemical storage technologies that do not enjoy appreciable commercial deployment today. Overnight 2008 pricings are most certain: for the 90% solution and hydrogen storage one gets approximately 23.5¢/kWh vs. about 10.5¢/kWh for 2008 - 2020 nuclear, a 124% penalty. If one accepts substantial breakthrough in hydrogen storage cost over next 17 years – and it could happen – then we would estimate 11.5¢/kWh for renewables vs. 8.5¢/kWh for nuclear, only a 35% penalty. I’m a bit skeptical that GIV storage cost will ever dip beneath central battery storage, but again can’t rule out the possibility, because while EV batteries are optimized for substantially different goals (e.g. energy/weight) than a central battery, there will (eventually, just not by 2030) be a lot of EV’s, with no reason not to connect them to a smart grid with certain priorities and caveats.
As an aside, in their Table 5 Budischak et al. estimate further cost reductions that might be obtained if it were posible to sell surplus renewable electricity for its thermal equivalent rather than just dumping it, for example by retro-fitting natural gas homes with redundant electric baseboard heat that might be used instead of gas during times of surplus wintery wind. It’s certainly a worthwhile question, but one possibly better addressed within the context of a study more specifically focused on hitting sufficient overall societal greenhouse gas emission targets at minimal cost – of which electric power comprises merely the easiest 33% (Figure 13).
| Hours covered % | Power Capacity (GW) | Energy Produced (GWa)
| ||||
| 30% | 90% | 99.9% | 30% | 90% | 99.9% | |
| Solar PV | 0 | 0 | 16.2 | 0 | 0 | 2.64 |
| Offshore Wind | 0 | 14.4 | 89.7 | 0 | 6.16 | 38.3 |
| Inland Wind | 40.1 | 126 | 124 | 16.3 | 51.1 | 50.3 |
| Fossil | 61.7 | 56.9 | 28.3 | 15.4 | 2.18 | 0.017 |
| Total generation | 102 | 197 | 258 | 31.7 | 59.4 | 91.3 |
| Storage | 27.7 | 69.2 | 51.9 | 1.4 | 7.99 | 2.47 |
| . | ||||||
| PJM 1999 - 2002 | 72 | 31.5 (average load)
| ||||
| Hours covered by all renewables % | Hydrogen | Central Batteries | GIV
| |||
| 2008 | 2030 | 2008 | 2030 | 2008 | 2030 | |
| 30 | 11 | 9 | 11 | 9 | 11 | 11 |
| 90 | 22 | 10 | 23 | 15 | 28 | 09 |
| 99.9 | 36 | 17 | 45 | 25 | 32 | 17 |
In summary, the authors ignore wind and solar grid and transmission costs, which Germany’s experience suggests are non-negligible,86 and exclude any possible nuclear power contribution from their optimization “...because it cannot be ramped up and down quickly and its high capital costs make it economically inefficient for occasional use.” But as seen in 9.6.1 many nuclear plants – including all Gen III+ and IV – can follow load at least as well as their fossil counterparts, and being dispatchable with 90+% capacity factors and carbon footprint comparable to wind,87 there is no reason whatsoever to restrict nuclear to occasional use. And new build aside, by reducing the net amount of required new renewables generation, it is very likely employing current nuclear plant for their intended baseload use will decrease the future cost of a low-carbon grid. This possibility too was excluded. In short, although their current study is not without merit, “Cost-minimized combinations of wind power, solar power, and electrochemical storage, powering the grid up to 99.9% of the time” does not demonstrate a minimal cost low-carbon solution to powering the grid up to 99.9% of the time, only that the cost of wind power, solar power, and electrochemical storage needed to fill that bill by themselves will be exorbitant: 18.5¢/kWh vs 8.5¢/kWh for nuclear.88 (Note 15 Feb 2014: this section needs to be revisited. The 8.5¢/kWh for nuclear figure assumes 90% capacity factor, which certainly cannot be attained when powering the entire grid. Some combination of gas, storage, and renewables will also be required. See comments on NREL’s Renewable Energy Futures, section 10.5.5 below.)
10.5.2 Australia: Simplified Lang Model 2010
Likewise, the PJM study assumed constant load at 2008 values whereas Lang tries to meet estimated load growth out to 2050, which inevitably is what we must reach. Lang merely illustrates some easy-to-follow cost vs. emissions tradeoffs for different combinations of generation technologies we might employ while getting there. There are other differences as well, and optimization and more refined models can always make a good answer better – after one thoroughly understands the question. Lang suggests some likely results:
“Five options for cutting CO2 emissions from electricity generation in Australia are compared with a “Business as Usual” option over the period 2010 to 2050. The six options comprise combinations of coal, gas, nuclear, wind and solar thermal technologies.
“The conclusions: The nuclear option reduces CO2 emissions the most, is the only option that can be built quickly enough to make the deep emissions cuts required, and is the least cost of the options that can cut emissions sustainably. Solar thermal and wind power are the highest cost of the options considered. The cost of avoiding emissions is lowest with nuclear and highest with solar and wind power. Based on estimated costs for extra transmission capacity incurred because of wind generation in the USA, $1,000/kW of installed wind capacity is included... The transmission cost for wind power raises the cost of electricity by an assumed $15/MWh on average.”
It is at least suggestive that of the six energy-mix options Lang considered, the only one that provided effective carbon limitation (gas+nuclear) contained no renewables.92
10.5.3 Australia: Optimized AEMO Model, Draft Report April 2013
100 Per Cent Renewables Study – Draft Modelling Outcomes. From the Introduction:
“On 10 July 2011, the Australian Government announced its Clean Energy Future Plan. As one initiative under that plan, the former Department of Climate Change and Energy Efficiency (DCCEE) commissioned Australia Energy Market Operator (AEMO) to undertake a study which explores two future scenarios featuring a National Electricity Market (NEM) fuelled entirely by renewable93 resources. DCCEE specified a number of core assumptions on which AEMO was asked to base its study...
“Given its exploratory nature, this study should be regarded as a further contribution to the broader understanding of renewable energy. The findings are tightly linked to the underlying assumptions and the constraints within which the study was carried out. Any changes to the inputs, assumptions and underlying sensitivities would result in considerably different outcomes.
- The results indicate that a 100 percent renewable system is likely to require much higher capacity reserves than a conventional power system. It is anticipated that generation with a nameplate capacity of over twice the maximum customer demand could be required. This results from the prevalence of intermittent technologies such as photovoltaic (PV), wind and wave, which operate at lower capacity factors than other technologies less dominant in the forecast generation mix.
- The modelling suggests that considerable bioenergy could be required in all four cases modelled, however this may present some challenges. Much of the included biomass has competing uses, and this study assumes that this resource can be managed to provide the energy required. In addition, while CSIRO believe that biomass is a feasible renewable fuel (3), expert opinion on this issue is divided. (4,5)
- The costs presented are hypothetical; they are based on technology costs projected well into the future, and do not consider transitional factors to arrive at the anticipated cost reductions. Under the assumptions modelled, and recognising the limitations of the modelling, the cost to build a 100 percent renewable power system is estimated to be at least $219 to $332 billion, depending on scenario. In practice, the final figure would be higher, as transition to a renewable power system would occur gradually, with the system being constructed progressively. It would not be entirely built using costs which assume the full learning technology curves, but at the costs applicable at the time.
“It is important to note that the cost estimates provided in this study do not include any analysis of costs associated with the following:
- Land acquisition requirements. The processes for the acquisition of up to 5,000 square kilometres of land could prove challenging and expensive.
- Distribution network augmentation. The growth in rooftop PV and demand side participation (DSP) would require upgrades to the existing distribution networks.
- Stranded assets. While this study has not considered the transition path, there are likely to be stranded assets both in generation and transmission as a result of the move to a 100 percent renewable future.
“Costs for each of these elements are likely to be significant.”
Emphasis added. And just to ensure there are no internicene hard feelings,94 AEMO helpfully adds:
“This report is not to be considered as AEMO’s view of a likely future, nor does it express AEMO’s opinion of the viability of achieving 100 per cent renewable electricity supply.”
So it’s all right then. Needless to say, DCCEE explicitly excluded nuclear from its definition of “renewable,”95 with the now-predictable result AEMO’s $219 - $332 billion estimate eases in at over twice that of those definitions that do not. From New critique of AEMO 100% renewable electricity for Australia report by Dr. Ted Trainer, University of NSW:
“The core issue with high penetration renewables claims is to do with the amount of plant that would be needed to deal with the intermittency of wind and sun. When both are low supply can be maintained only if there is a substantial amount of some other kind of generating capacity, or of storage capacity, that can be turned to. Proposals attempting to provide for this end up having to assume very large quantities of back-up plant. For instance in the Elliston, Diesendorf and MacGill proposal (2012) the multiple is 3.37. In the Hart and Jacobson proposal for California (2011) the multiple is 4.3. They found that in order to meet a 66 GW demand with low carbon emissions no less than 281 GW of capacity would be needed. This would include 75 GW of gas generating capacity which would function a mere 2.6% of the time (p. 2283) and it would provide only 5% of annual demand. This means 75 power stations would sit idle almost all the time.”96
And in 100 Per Cent Renewables Study Needs a Makeover, Martin Nicholson estimates
“According to AEMO, to convert the NEM to a 100 per cent renewable system will cost at least $219 to $332 billion... If the primary aim of the DCCEE is to reduce emissions, replacing the coal plants with nuclear will do the job by reducing emissions from electricity generation from 196 Mt CO2-e in 2010 to 30 Mt in 2050; a reduction greater than the national target of 80 per cent by 2050... based on the same BREE costing source used by AEMO for its study, replacing all the coal plants with nuclear power will cost only $91 billion. Less than half the lowest cost scenario for the 100 per cent renewable system. The savings come largely from reducing the need for additional capacity reserves demanded by the prevalence of intermittent technologies.”97
In regards to which, the AEMO Draft reports “results indicate that a 100 per cent renewable system is likely to require much higher energy reserves than a conventional power system. It is anticipated that generation with a nameplate capacity of over twice the maximum customer demand could be required. This results from the prevalence of intermittent technologies such as PV, wind and wave, which operate at lower capacity factors than other technologies less dominant in the forecast generation mix”98 – similar to the Budischak et al. estimate of 290% overbuild for PJM.
As with the Budischak group’s PJM study, this Australian AEMO report has its strong points. Optimization is via Monte-Carlo sampling, and the cost function included increased transmission.99 Nonetheless, the AEMO authors clearly felt constrained by DCCEE’s artificial constraints. Their results feel that way as well.
10.5.4 The United Kingdom: Low Carbon Future 2011
“Prof John Beddington affirmed importance of atomic power to UK at the launch of long-term nuclear strategy. Beddington led a review of the nuclear research and development programme needed if the government’s high-nuclear scenario for future energy is to be feasible. Prof David MacKay, chief scientific adviser at the Department of Energy and Climate Change, said this scenario – one of four set out in the 2011 carbon plan – envisaged 75GW of nuclear capacity in 2050 providing 86% of the UK’s electricity, a situation he compared to France today.”
See Her Majesty’s Government’s The Carbon Plan: Delivering our Low Carbon Future (220 page pdf). From the Executive Summary:
- The power sector accounts for 27% of UK total emissions by source. By 2050, emissions from the power sector need to be close to zero.
- With the potential electrification of heating, transport and industrial processes, average electricity demand may rise by between 30% and 60%. We may need as much as double today’s electricity capacity to deal with peak demand. Electricity is likely to be produced from three main low carbon sources: renewable energy, particularly onshore and offshore wind farms; a new generation of nuclear power stations; and gas and coal-fired power stations fitted with CCS technology. Renewable energy accounted for approximately half of the estimated 194 GW of new electricity capacity added globally during 2010. Fossil fuels without CCS will only be used as back-up electricity capacity at times of very high demand. The grid will need to be larger, stronger and smarter to reflect the quantity, geography and intermittency of power generation. We will also need a more flexible electricity system to cope with fluctuations in supply and demand.
So. The 86% Solution. The “By 2050, emissions from the power sector need to be close to zero” and “gas and coal-fired power stations fitted with CCS technology” requirements are completely consistent with those found by the global optimization study to be discussed in section 10.5.6. And to anyone who wonders “What were these guys thinking?”, I would once again remind them that Prof MacKay has gone to some length over the years to publicly explain. Sustainable Energy: Without the Hot Air is actually a lively and entertaining read. In the present context see Can we live on renewables?.
But just as I disfavor shuttering perfectly good nuclear plant just because current gas price is low and Production Tax Credit counterproductive, neither do I favor scrapping operational wind and solar farms just because they offend my personal esthetic and environmental sensibilities. All these optimal solutions include some degree of wind and solar. The goal is to most rapidly minimize carbon emissions at lowest cost with the tools available.
10.5.5 The United States: Renewable Electricity Futures Study 2012
“RE Futures is an initial analysis of scenarios for high levels of renewable electricity in the United States; additional research is needed to comprehensively investigate other facets of high renewable or other clean energy futures in the U.S. power system. First, this study focuses on renewable-specific technology pathways and does not explore the full portfolio of clean technologies that could contribute to future electricity supply. Second, the analysis does not attempt a full reliability analysis of the power system that includes addressing sub-hourly, transient, and distribution system requirements. Third, although RE Futures describes the system characteristics needed to accommodate high levels of renewable generation, it does not address the institutional, market, and regulatory changes that may be needed to facilitate such a transformation. Fourth, a full cost-benefit analysis was not conducted to comprehensively evaluate the relative impacts of renewable and non-renewable electricity generation options.”
Emphasis added. Sounds much like the introduction to the AEMO study, perhaps sanitized a bit for American sensibilities. The authors are quite clear: “The scenarios were not constructed to find the optimal GHG mitigation or clean energy pathway e.g., to minimize carbons emissions or the cost of mitigating these emissions.”101
As for nuclear, that is part of the “full portfolio of clean technologies” not considered: “RE Futures did not allow new nuclear plants, fossil technologies with CCS, as well as gasified coal without CCS (integrated gasification combined cycle) to be built in any of the scenarios presented in this report. Existing nuclear (and integrated gasification combined cycle) units, however, were included in the analysis, as were assumptions for the retirement of those units.”102 With such limitations the study therefore does not and cannot address the fundamental question “How do we most rapidly minimize carbon emissions at lowest cost with the tools available? The authors recognize as much. From their Conclusions (pages 30-31):
“...many aspects of the electric system may need to evolve substantially for high levels of renewable electricity to be deployed. Significant further work is needed to improve the understanding of this potential evolution, such as the following:
- A comprehensive cost-benefit analysis to better understand the economic and environmental implications of high renewable electricity futures relative to today’s electricity system largely based on conventional technologies and alternative futures in which other sources of clean energy are deployed at scale.
- Further investigation of the more complete set of issues around all aspects of power system reliability because RE Futures only partially explores the implications of high penetrations of renewable energy for system reliability
- Improved understanding of the institutional challenges associated with the integration of high levels of renewable electricity, including development of market mechanisms that enable the emergence of flexible technology solutions and mitigate market risks for a range of stakeholders, including project developers
“RE Futures... included wind, utility-scale and rooftop PV, CSP, hydropower, geothermal, and biomass – under a range of assumptions for generation technology improvement, electric system operational constraints, and electricity demand. Within the limits of the tools used and scenarios assessed, hourly simulation analysis indicates that estimated U.S. electricity demand in 2050 could be met with 80% of generation from renewable energy technologies with varying degrees of dispatchability together with a mix of flexible conventional generation and grid storage, additions of transmission, more responsive loads, and foreseeable changes in power system operations.”
While RE Futures might not press the questions that most need pressing, it’s what we’ve got and is fairly comprehensive at what it is. Let’s see what we can get from it:
RE Futures is based upon two low electricity demand scenarios: Low-Demand assumes 0.17% yearly growth; High-Demand assumes 0.84% as illustrated in Figure 1-2 (5).
![[Picture]](../img/Fig1-2.png "click to enlarge")
RE Futures Low-Demand assumed a very-low demand growth of 0.17%/yr, High-Demand assumed a low 0.84%/yr, significantly lower than the historical annual growth rate of approximately 2.4% from 1970 to 2010.103 RE Futures used 3656 TWh total demand in base year 2010, increasing by 7% to 3913 TWh in 2050 under their “low-demand” scenario and by 39.7% to 5109 TWh under high. Figure 2-2 (6) (or ES-3 of the Executive Summary) illustrates installed generation in 2050 on the (low-demand, RE-ITI technology improvement) scenario, and is reproduced here as Figure (6):
![[Picture]](../img/Fig2-2_ES-3a.png "click to enlarge")
![[Picture]](../img/Fig2-2_ES-3b.png "click to enlarge")
| Low-Demand Generation Mix, GHG emissions, and percent reduction from Baseline in 2050
| |||||||||||
| Nuclear | Coal | NG | Bio | Geo | Hydro | CSP | PV | Wind | tCO2e/GWh | % reduced | |
| Baseline | 0.11 | 0.53 | 0.16 | 0.01 | 0.03 | 0.08 | 0.00 | 0.00 | 0.06 | 614 | 0 |
| 80% RE | 0.08 | 0.09 | 0.03 | 0.15 | 0.04 | 0.11 | 0.07 | 0.06 | 0.37 | 119 | 80.6 |
| 90% RE | 0.05 | 0.03 | 0.02 | 0.15 | 0.04 | 0.12 | 0.12 | 0.07 | 0.41 | 58 | 90.6 |
| Low-Demand No-Coal Generation Mix in 2050 (GW)
| |||||||||||
| 85% Sus | 0.64 | 0 | 0.16 | 0.01 | 0.03 | 0.08 | 0.00 | 0.00 | 0.06 | 94 | 84.7 |
| 89% Sus | 0.64 | 0 | 0.12 | 0.01 | 0.03 | 0.12 | 0.00 | 0.00 | 0.06 | 66 | 88.5 (89.2) |
| 98+% Sus | 0.80 | 0 | 0.00 | 0.01 | 0.03 | 0.08 | 0.00 | 0.00 | 0.06 | 11 (5.8) | 98.2 (99.1) |
| Low-Demand “Renewable” Capacity Mix in final year 2050 (GW)
| |||||||||||||
| Nuclear | Coal | NG | Bio | Geo | Hydro | CSP | PV | Wind | Storage | Total | Ratio | CF | |
| Base | 56.65 | 300 | 395 | 9.34 | 15.8 | 78.8 | 0.45 | 8.4 | 82.6 | 27.70 | 975 | 2.18 | 46% |
| 80% | 56.65 | 87.3 | 266 | 95.00 | 24.1 | 114.1 | 56.5 | 168 | 461 | 122.25 | 1451 | 3.25 | 31% |
| 90% | 56.65 | 46.9 | 235 | 96.58 | 24.1 | 129.8 | 101.7 | 187 | 517 | 142.42 | 1537 | 3.44 | 29% |
| Low-Demand No-Coal “Sustainable” Capacity Mix in 2050 (GW)
| |||||||||||||
| 85% | 357 | 0 | 395 | 9.34 | 15.8 | 78.8 | 0.45 | 8.4 | 82.6 | 27.7 | 975 | 2.18 | 46% |
| 89% | 357 | 0 | 344 | 9.34 | 15.8 | 129.8 | 0.45 | 8.4 | 82.6 | 27.7 | 975 | 2.18 | 46% |
| 98+% | 752 | 0 | 0 | 9.34 | 15.8 | 78.8 | 0.45 | 8.4 | 82.6 | 27.7 | 975 | 2.18 | 46% |
Update 12/15/2013:
For comparison, we have simply substituted nuclear first for coal, then for both coal and NG in REF’s
Baseline scenario to obtain a final “no-fossils” mix in the above tables. We see that emissions are reduced
more (by 85%) merely by replacing coal with nuclear in the baseline scenario than they are with REF’s
“optimal” 80% RE low-demand solution, and are within 2% of the 90% RE solution if 25% of the NG is
then replaced by an equivalent capacity of hydropower. Capital costs are less for nuclear, hidden in the
“Details” below.
(End update.)
Save for hydro, source emissions are obtained by dividing column H by column G of RE Futures Table C-3: Nuclear
10.6 (4), Coal 1000,
NG 500,
Biomass 0, Geo 9.7, Hydro 26, CSP 78.5, PV 37.4, Wind 4.6, all as tCO2e/GWh. The hydro value is from
Lifecycle GHG Emissions of Electricity Generation. The alternate 4 tCO2e/GWh for nuclear is from
Energy Balances and CO2 Implications, citing Vattenfall’s Forsmark plant in Sweden achieving
3.1 tonne CO2e/GWh. Total GHG emissions/GWh is just the sum of the products of each
component’s source emission and the component’s fraction in the mix. For the Baseline case this is
(10.60.11 +
10000.53 +
5000.16
+ 9.70.03 +
260.08 +
4.60.06)
= 614 tCO2e/GWh.
The Ratio column of the Capacity Mix table gives the ratio of Total capacity to the 446.6 GW average
demand anticipated for 2050 under the low-demand scenario (3912TWh/y / 8760h/y = 446.6GW). The
last column gives its inverse, the grid’s total net Capacity Factor. The REF study assumes the 80%
solution is consistent with maintaining atmospheric CO2 beneath 460 ppm CO2, an assumption (also
questioned at table 6 below) Prof MacKay finds optimistic: the Rest of The World wants its piece of the
pie,104  and in any event we will have a fixed CO2 emissions budget and squandering a full 50% (coal+gas) of it
on fixed-source electricity generation seems shortsighted. High energy-density, compact, portable fossil
resources should be purposed for what they serve their very best: transportation fuels. And that 15%
biomass may be a solid DoE estimate, but I’ll unlikely be the only one to call it in question. That’s a lot of
weed going up in smoke.
and in any event we will have a fixed CO2 emissions budget and squandering a full 50% (coal+gas) of it
on fixed-source electricity generation seems shortsighted. High energy-density, compact, portable fossil
resources should be purposed for what they serve their very best: transportation fuels. And that 15%
biomass may be a solid DoE estimate, but I’ll unlikely be the only one to call it in question. That’s a lot of
weed going up in smoke.
But neither am I the one doing the modeling, and 2050 is well beyond my own expiration date. I’m nonetheless going to suggest biomass beyond 5% (if that much) will not prove sustainable and unless captured, that carbon from coal will be better spent elsewhere. RE Futures does not assume CCS, as it is not yet a commercial technology. If the resulting deficit were to be met with nuclear, that would push its contribution to 20% - 27% of the national mix, at least double what it is today.105
The study’s low-demand scenario places electric cost growth at 1.1%/y 2015 - 2050, high-demand at 1.3% resulting in respectively 47% and 58% price increase over the thirty-five year period, up to a final 16¢/kWh in 2050 (Figure 7). Which might seem reasonably bearable, were it not that EIA expects nuclear costs to actually decrease somewhat from about 10.5¢/kWh down to about 8.5¢/kWh over the same period106 and grid integration of nuclear is much simpler and cheaper. 107 (8.5¢/kWh would be for baseload nuclear. See updated Costs in “Details” below.) As we see in the above table, nuclear may also emit one tenth the CO2 as the 80% renewables combination obtained in the REF study.
![[Picture]](../img/FigA-4a.png "click to enlarge")
![[Picture]](../img/FigA-4b.png "click to enlarge")
Update 12/22/2013: add tabulated values for the above figure (REF Figure A-4). In each scenario ITI costs are higher than ETI.
| Present Value of System Costs (2011-2050 at 3% discount rate, in Billion 2009$)
| ||||||||
| Conventional | Renewable | Diff. from Baseline | ||||||
| Generation | Generation | Storage | Trans | Total | Total | R+T | New | |
| Baseline | $3,374.22 | $541.23 | $24.24 | $50.81 | 3990.50 | 0 | 0 | 0 |
| $3,374.22 | $541.23 | $24.24 | $50.81 | 3990.50 | 0 | 0 | 0 | |
| 30% RE | $3,149.81 | $671.62 | $27.03 | $59.38 | 3907.84 | -82.7 | 139 | 166 |
| $3,210.06 | $763.45 | $26.11 | $55.37 | 4054.99 | 64.5 | 227 | 253 | |
| 80% RE | $2,198.28 | $1,870.98 | $80.12 | $165.73 | $4,315.11 | 325 | 1445 | 1525 |
| $2,232.49 | $2,360.71 | $97.95 | $168.57 | $4,859.72 | 869 | 1937 | 2035 | |
| 90% RE | $2,022.96 | $2,193.93 | $97.66 | $201.70 | $4,516.25 | 526 | 1804 | 1901 |
| $2,075.92 | $2,750.35 | $116.50 | $210.17 | $5,154.94 | 1164 | 2368 | 2485 | |
| 85% RE | $2,110.62 | $2,032.45 | $88.89 | $183.46 | $4,415.68 | 425 | 1624 | 1713 |
| $2,154.20 | $2,555.53 | $107.22 | $189.37 | $5,007.33 | 1017 | 2153 | 2260 | |
| 85% Sus | $3,824.22 | $541.23 | $24.24 | $50.81 | $4,440.50 | 450 | 0 | 1650 |
Capital saved: | 63 | |||||||
| 610 | ||||||||
New = (New Renewable Generation + New Storage + New Transmission + New Nuclear)
85% RE = (Average of 80% RE and 90% RE)
85% Sustainable (last row) simply assumes RE Futures’s Baseline 300 GW coal capacity, valued at $4/W, is completely replaced by an equal amount of new nuclear at $5.50/W, for a net $450 billion increase in “conventional” value.
The difference between 85% Sustainable’s New capacity value and that for 85% RE in the previous two
rows, $1713-$1650 = $63 billion for ETI and $2260-$1650 = $610 billion for ITI, represents the capital
cost savings of an “85% Sustainable” solution over the REF 85% Renewable – assuming a similar value
for stranded fossil assets in each case. From Figure (6) we see REF decreases both coal and
natural gas relative to Baseline, retaining some coal at the end to co-fire biomass. In contrast,
our simple 85% Sustainable retains all Baseline NG generation, and completely eliminates
its coal in favor of nuclear. But not all new nuclear will be sited on the same location as the
displaced coal plant, which will necessitate some (unaccounted) increase in nuclear transmission
costs. Beyond 85% – and avoidance of climate catastrophe will require far beyond 85% – any
additional grid storage can be well used for load peak shaving by any generation technology, and
renewables can further help reduce fuel consumption of remaining variable-load gas plants.
(End update)
RE-ITI (Incremental Technology Improvements) are probably the more
realistic, as ETI (Evolutionary Technology Improvements) assume a bit of
magic.108
“Wholesale electricity prices were estimated within ReEDS based on a simplified assumption of a
regulated structure for all markets, using a 30-year rate base calculation.” (RE Futures Vol. 1 page A-30).
Which invites the obvious: “Can a Renewables Future – or any Sustainable Low-Carbon Future – work in
an unregulated market?”
Firstly, “The Low-Demand Baseline scenario assumes that a combination of emerging trends including policies and legislation dealing with codes and standards, innovation in energy efficiency, and the green building and supply chain movements – drive the adoption of energy efficiency measures in the residential, commercial, and industrial sectors. Substantial adoption of electric and plug-in hybrid electric vehicles was also assumed. In aggregate, these low-demand assumptions resulted in overall electricity consumption that exhibits little growth from 2010 to 2050.”109
We next cherry-pick from pages 1-22 ff of the report:
Conventional Generation Technologies
“First, although ReEDS (Regional Energy Deployment System, NREL’s least-cost
optimization capacity expansion model) has the technical capability to consider new
nuclear plant builds, fossil technologies with carbon capture and storage (CCS), and
gasified coal without (and presumably with) CCS, RE Futures chose not to allow
new builds of other possible low-carbon generation technologies, including these
technologies, because the focus of this study was on technical issues associated
with high levels of renewables and because no carbon or related policies were
considered. The future cost of nuclear power plants as well as power plants using
CCS is particularly uncertain. In addition, deployment of these technologies will be
highly dependent on policy decisions and institutional and social factors, which are
beyond the scope of RE Futures. Instead, RE Futures focused on scenarios with high
penetrations of renewable energy, and therefore chose to not allow new builds of other
possible low-carbon generation technologies.”
...which is just as well, as admitting low-carbon generation technologies other than renewables into the solution space might yield some discouraging results. One reason explicitly stated in Section 2.5.2 Operating Reserves (pg 2-17):
“ReEDS seeks to balance supply and demand not only by ensuring adequate overall capacity on the system but also by ensuring adequate operating reserves (delivered by both supply- and demand-side technologies) to manage variability and uncertainty in load and generation at short timescales – seconds to minutes. These operating requirements can be viewed as another form of ‘reserve’ capacity that is needed by the electricity system as a whole, and these needs increase with higher penetrations of variable renewable generation. Of most interest here is that imperfect forecasts of the output of wind and PV require additional operating reserve capacity; as the capacity of these variable sources increases, forecast errors are assumed to become larger in absolute terms, driving operating reserve capacity requirements higher.”
Emphasis in original, although one suspects the problem goes far beyond meteorological forecasting and is inherent to the intermittency and resulting low capacity factors of wind (33%) and solar (18-20%). Either way, the effect is clearly illustrated in Figure A-4 (b) 7 which shows steady increase in cost/kWh beyond renewable penetration of about 30%, a result qualitatively consistent with the Delaware PJM study. At the risk of belaboring the point, the authors explain110
“Because of the relatively limited dispatchability, variability, and lower capacity factors of wind and PV technologies and their growing deployment in these scenarios, increasing renewable electricity (from 20% in the Low-Demand Baseline scenario to as high as 90% at the other end) drives the need for a growing amount of aggregate electric generation capacity in order to meet demand, even with low-demand growth. Under the Low-Demand Baseline scenario, 950 GW of total capacity was required by 2050; under the 90% RE scenario, on the other hand, 1,390 GW was required to meet the same level of aggregate electricity demand. Wind and PV capacity does not contribute fully to planning reserves, thus capacity is required from other sources, including dispatchable renewable and storage technologies, resulting in overall greater system capacity.”
Not to mention complexity.
Section 2.3 Emissions Decline with Increasing Renewable Electricity Penetration:
No surprise here – that’s the whole purpose of the exercise. What’s interesting is the rate of emissions decline, as shown
in Figure 2-4111
which shows, relative to the Low-Demand Baseline, 2050 annual direct combustion CO2 emissions
declined by approximately 10% in the 30% RE scenario, 55% in the 60% RE scenario, 82% in the 80%
RE scenario, and 95% in the 90% RE scenario. In other words, we don’t begin to see a CO2 emissions
reduction commeasurate with renewables penetration until we reach the 80% RE scenario – just when
generation from coal is reduced to near that of nuclear.
Cost
(Updated 12/22/2013)
Refering back to Figure (7), we see for 80% RE-ITI a low-demand estimated system cost
just for renewables (and their storage and transmisison) of 3 2.63 trillion dollars, or 2.5 2
trillion over the Baseline – the path EPA predicts we are on – which itself predicts renewables
growth and nuclear will decline. From Figure (6) this corresponds to 65% from Biomass, Wind,
and Solar renewables in the considered 80% low-demand scenario, which from Figure (5)
demands but 4 PWh/yr, or 2.5 PWh/yr from BWS and 9% or 0.36 PWh/yr from coal. Just as a
ballpark,112
retaining the 3% NG and 8% existing nuclear from REF’s 80% scenario and the combined
18% renewable from Baseline, suppose we wished to generate the remaining 71% of that 4
PWh/yr from new nuclear plants, or 2.8 PWh/yr. At 8760 h/yr and capacity factor 0.9, those
2.8 PWh/y would soak 356 GW of new nuclear capacity. At an overnight cost of $6.25
billion/GW,113
that’s $2.222 trillion or $625 less $211 billion more than the $2.011 trillion cost of renewables but without
the reliability and environmental issues. At $5.5 billion/GW the nuclear capital cost is $1.958 trillion, or
$53 billion less. Either way, the 71% nuclear – 3% NG scheme would reduce carbon emissions to 26.3
tCO2e/GWh, compared to 119 tCO2e/GWh for 80% RE. (It’s also rather unrealistic, see update
below.)
It isn’t necessarily this good. NRG’s David Crane estimated $20 billion for the two AP1000 he elected not to build when faced with selling into an unregulated wind-driven market. Increasing nuclear capital and finance 33% from $6.25/W to $8.33/W pushes the above nuclear cost close to $3 trillion.
But it isn’t necessarily that bad, either. SCG&E hopes to bring its two AP1000 in for $10 billion. RE Futures estimates a decreasing cost of renewables over time, and constant cost for nuclear, EIA estimates levelized cost of nuclear electricity will drop from about 10¢/kWh to about 8.5¢/kWh in constant 2009 pennies between 2020 and 2040, wind from 8.5¢ to 7.5¢.114 From Figure 7, RE Futures predicts 16¢/kWh by 2050 in their low-demand 80% RE scenario – over twice as much. Clearly, our mileage will vary.
(Update 12/22/2013) The above cost argument is overly simplistic as it assumes nuclear can maintain 90% capacity factor while supplying 74% of demand, which would include not only baseload but a fair fraction of variable demand as well. While routinely attained for baseload, such high capacity factor is unrealistic for variable demand. Nuclear Power in France, for example, “has total capacity factor of around 77%, which is low due to load following, and would be even lower were France not able to balance load by importing electricity during very cold and hot periods, and sell surplus nuclear power at other times.”
However, in the table following Figure (7) we have seen we may also do better than REF’s 80% RE low-demand scenario simply by replacing the 300 GW coal in their low-demand baseline with nuclear, giving an 85% Sustainable solution for which there is clear cost advantage. REF estimates capacity factors of 79% for coal and 87% for nuclear; these are similar enough that for present argument we’ll assume nuclear to be a drop-in replacement for coal. Then at $5.5 billion/GW, overnight capital cost of replacing 300 GW coal would be $1.65 trillion, assuming no coal plant would need be replaced between now and then anyway. (All coal assests stranded.) On the other hand, if we assume half the 300 GW coal capacity will need be replaced at $4 billion/GW over the next 36 years in the baseline scenario, the nuclear replacement cost is reduced to 150 GW $5.5 billion/GW + 150 GW ($5.5 - $4.0) billion/GW = $1.05 trillion. Assuming a capital cost for gas plant of $1/W, the renewable bill is similarly reduced to $2.26 trillion - 0.5((300-67)GW $4/W - (395-250) GW $1/W) = $1.72 trillion. The capital cost of nuclear plant will thus be $670 billion less than renewables, that $670 billion representing some 40% of nuclear’s $1.65 trillion total.
Over the 35 year term of the proposed build-out, this amounts to $19 billion each year. At $5.50/W that’s savings enough to finance 3.5 GW new nuclear capacity each year – 3 GW sustained. Since its coal being replaced, and coal emits about 964 tCO2e/GWh against 10.6 for nuclear (REF numbers) $19 billion saves an additional (3GW8760h/y 953 tCO2e/GWh) = 25 million tCO2e decrement each year.
This is only an estimate. We’ve assumed a capital cost for nuclear build of $5.5/W, constant in today’s dollars over the next 35 years. While there are no recent nuclear completions in this country to go by, four Gen III+ reactors are prescently under construction: Georgia Power estimates its first two AP1000 at $7.5 billion each, SCE&G estimates $5 billion. These are 1.17 GW plants. At 90% capacity factor these respectively correspond to $7.12/W and $4.75/W. If sustained, the first would put the nuclear capital cost at 150 GW $7.5 billion/GW + 150 GW ($7.5 - $4.0) billion/GW = $1.65 trillion, 96% renewables’ and close enough to call it even. The latter would reduce nuclear capital cost to $825 billion, only 48% renewables’ and similar to Martin Nicholson’s Australian estimate cited in section 10.5.3. From Levelized Costs of New Generation by Source we find nuclear might be about 8% more costly than conventional coal, but 15% - 25% cheaper than advanced coal technologies. From Figure (7) we might estimate an approximate 2050 retail price of $158/MWh for an 85% RE-ITI scenario, vs. $85 - $110/MWh for baseload nuclear. (Our simple 85% Sustainable replace-coal-with-nuclear scenario runs nearly all nuclear as baseload, most of the rest is supplied by natural gas.)
This has been but a quick back-of-the envelope estimate, and is by no means definitive. One neglected
issue is the factor of 2 or 3 longer service life nuclear power enjoys relative to wind and solar: by 2050 a
nuclear plant entering service in 2018 will be just past half its 60 year design life, and probably be good
’till the end of the century if granted a 20-year extension. Nuclear power is expensive up front, but cheap
if you can afford it. And clearly, the exigencies of climate change will require electric power ghg
emissions reductions well in excess of 85%. Given the enormity of that task, detailed analysis is urgently
needed to determine optimal low-carbon strategies utilizing all available generation technologies.
(End update.)
All in all, one might mistakenly conclude RE Futures is rather more an argument in favor of nuclear than it is renewable energy. But as its authors point out, it is actually neither: that argument must be resolved via thorough cost-benefit analysis that is TBD. All in good time. When it is done, I expect our U.S. Carbon Plan will look much like the United Kingdom’s, though perhaps a bit more renewable as befits our breezy nature and sunny disposition.
10.5.6 The World: Pathways for Stabilization of Radiative Forcing by 2100
It should not be surprising that research focused on the fundamental question How do we most rapidly minimize carbon emissions at lowest cost with the tools available? tends to be focused by scientists, economists, and other researchers contributing to the International Panal on Climate Change. Also not surprising, they tend to take a global view. We first briefly review Representative Concentration Pathways (RCP) as used in the IPCC’s soon-to-be-released Fifth Assessment Report (AR5) and their use as input drivers for Integated Assessment Models (IAM), then look at an ongoing IAM study that tries to determine whether and how we might avert climate catastrophe, with focus on particular results published in 2011 by researchers at Pacific Northwest National Laboratory, the University of Maryland, and PBL Netherlands Environmental Assessment Agency. Nuclear power plays a dominant role in their cost-optimized economic models for greenhouse gas abatement.
In the years since the IPCC’s Fourth Assessment Report (AR4), climatologists and global warming researchers have revised the methods by which they estimate reasonably Representative Concentration Pathways for atmospheric greenhouse gas and other pollutants. RCP’s are possible concentration profiles of these atmospheric gasses as functions of time from the present (or somewhat before) to some time in the future. They largely depend upon past, present, and future human choices that determine how much of each is emitted. Different future choices will lead to different RCPs. IPCC scientists have chosen four representative pathways, each leading to different radiative solar forcings by the end of this century; we excerpt from G.P. Wayne’s The Beginner’s Guide to Representative Concentration Pathways Parts 2 and 3:
RCP: Representative Concentration Pathways.
“In year 2000 the IPCC released a second generation of projections, collectively referred to as the Special Report on Emissions Scenarios (SRES). These were used in two subsequent reports; the Third Assessment Report (TAR) and Assessment Report Four (AR4) and have provided common reference points for a great deal of climate science research in the last decade.”115
SRES generated climate scenarios, used in TAR and AR4 and most climate research in between, in a sequential fashion starting from Emissions and Socio-economic scenarios (Integrated Assessment Models, IAMS), from which Radiative forcing could be estimated and used as input to Climate Models (CMs) to predict future climate change. Impacts, Adaptation, and Vulnerability (IAV) studies then followed.
The Radiative Forcings are of course determined by the instantaneous atmospheric composition as a function of time, as well as surface albedo as it is affected by changing land use. Cloud effects and snow are presumably part of the climate model
In a departure from previous SRES scenario generation, IPCC AR5 (Fifth Assessment Report) builds upon this prior scenarios generation experience and resulting radiative forcing time projections, to invert the first part of the process and assume a “standard set” of four radiative forcing time projections from which the climate modelers can work directly, while at the same time the IAMS people could work back to determine what various ranges of emissions and socio-economic factors could plausibly lead to a particular radiative forcing.
A time-progressing atmospheric composition that might result in a particular radiative forcing sequence is termed a Concentration Pathway. While a wide variety of different concentration pathways – more CO2 here, less methane there, different amounts of NO2 and VOCs – a standard set of four such pathways are chosen as representative of what previous research has indicated as reasonable. That is, the Representative Concentration Pathways were not just pulled from thin air.
One advantage to this new approach is that (we think) previous research experience has already given a very good idea what the climatic effects of any of these RCP’s is going to be:
“By fixing the emissions trajectory and the warming, RCPs come at the problem the other way round. Socio-economic options become flexible and can be altered at will, allowing considerably more realism by incorporating political and economic flexibility at regional scales. Policy decisions on mitigation and adaptation can be tested for economic efficacy, both short and long term. Researchers can test various socio-economic measures against the fixed rates of warming built into the RCPs, to see which combinations of mitigation or adaptation produce the most timely return on investment and the most cost-effective response.”
Four RCPs...produced from IAM scenarios available in the published literature: one high pathway for which radiative forcing reaches W/ by 2100 and continues to rise for some amount of time; two intermediate “stabilization pathways” in which radiative forcing is stabilized at approximately 6 W/ and 4.5 W/ after 2100; and one pathway where radiative forcing peaks at approximately 3 W/ before 2100 and then declines. These scenarios include time paths for emissions and concentrations of the full suite of GHGs and aerosols and chemically active gases, as well as land use/land cover...
- was developed using the MESSAGE model and the IIASA Integrated Assessment Framework by the International Institute for Applied Systems Analysis (IIASA), Austria. This RCP is characterized by increasing greenhouse gas emissions over time, representative of scenarios in the literature that lead to high greenhouse gas concentration levels (Riahi et al. 2007).
- was developed by the AIM modeling team at the National Institute for Environmental Studies (NIES) in Japan. It is a stabilization scenario in which total radiative forcing is stabilized shortly after 2100, without overshoot, by the application of a range of technologies and strategies for reducing greenhouse gas emissions (Fujino et al. 2006; Hijioka et al. 2008).
- was developed by the GCAM modeling team at the Pacific Northwest National Laboratory’s Joint Global Change Research Institute (JGCRI) in the United States. It is a stabilization scenario in which total radiative forcing is stabilized shortly after 2100, without overshooting the long-run radiative forcing target level (Clarke et al. 2007; Smith and Wigley 2006; Wise et al. 2009).
- was developed by the IMAGE modeling team of the PBL Netherlands Environmental Assessment Agency. The emission pathway is representative of scenarios in the literature that lead to very low greenhouse gas concentration levels. It is a “peak-and-decline” scenario; its radiative forcing level first reaches a value of around 3.1 W/ by mid-century, and returns to 2.6 W/ by 2100. In order to reach such radiative forcing levels, greenhouse gas emissions (and indirectly emissions of air pollutants) are reduced substantially, over time (Van Vuuren et al. 2007a). (Characteristics quoted from van Vuuren et.al. 2011)
![[Picture]](../img/rcp-guide-table4.png "click to enlarge")
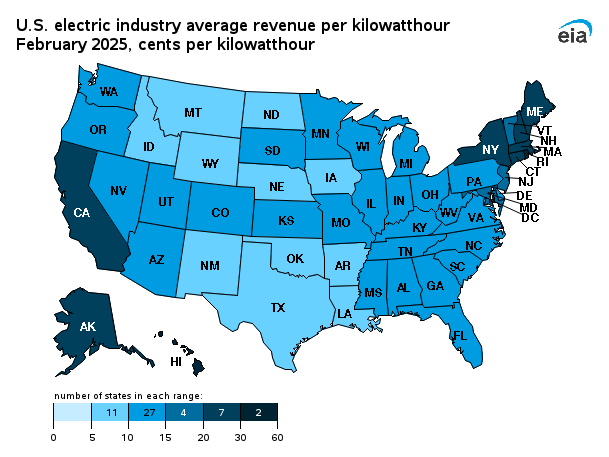
The forcing trajectories are consistent with socio-economic projections unique to each Representative Concentration Pathways. For example, RCP2.6 (RCP3PD) assumes that through drastic policy intervention, greenhouse gas emissions are reduced almost immediately, leading to a slight reduction on today’s levels by 2100. The worst case scenario - RCP8.5 - assumes more or less unabated emissions.
![[Picture]](../img/emissions-graph-rpc.png "click to enlarge")
![[Picture]](../img/ghg-concentrations-small.gif "click to enlarge")
Grey area indicates the 98th and 90th percentiles (light/dark grey) of the literature...The dotted lines indicate four of the SRES marker scenarios. Note that the literature values are not harmonized. From van Vuuren et.al. 2011, and Clarke et al. 2010. Source: G.P. Wayne The Beginner’s Guide to Representative Concentration Pathways Figures 8 and 9.
By way of explanation:
“In terms of the mix of energy carriers, there is a clear distinction across the RCPs given the influence of the climate target. Total fossil-fuel use basically follows the radiative forcing level of the scenarios; however, due to the use of carbon capture and storage (CCS) technologies (in particular in the power sector), all scenarios, by 2100, still use a greater amount of coal and/or natural gas than in the year 2000. The use of oil stays fairly constant in most scenarios, but declines in the RCP2.6 (as a result of depletion and climate policy).
“The use of non-fossil fuels increases in all scenarios, especially renewable resources (e.g. wind, solar), bio-energy and nuclear power. The main driving forces are increasing energy demand, rising fossil-fuel prices and climate policy. An important element of the RCP2.6 is the use of bio-energy and CCS, resulting in negative emissions, and allowing some fossil fuel without CCS by the end of the century”. (van Vuuren et.al. 2011).
Emphasis added. Once emitted, atmospheric CO2 in excess of what the biosphere has evolved to metabolize, is generally thought to have residence times in excess of thousands of years. RCP 2.6 attempts to “turn back the clock” and calls for explicit reduction of atmospheric CO2 by capturing the CO2 produced from burning biomass for energy. Large-scale CCS (Carbon Capture and Storage) is assumed: essentially all fossil fuel use must be subject to stringent CCS.
We recall that the Renewable Energy Futures Study 2012 (Section 10.5.5) specifically excluded CCS because it is not at present a commercial technology. CCS is expensive on thermodynamic considerations alone, and is estimated to add 30 - 50% to the cost of burning fossil fuels. Clearly, CCS is not going to happen without carbon tax or cap-and-trade. But there do not appear to be any insurmountable technical barriers. One place to sink captured CO2 is in oil and gas fields near the end of their productive lives, where CO2 is already often used to enhance tertiary recovery. The fossil fuels were trapped in those reservoirs for tens of millions of years, they should be tight against CO2 for at least as long. Another is direct capture and storage as carbonate.
An Integrated Assessment Modeling Study
These projections can make useful inputs to a National Energy Policy or National Carbon Plan: choose a reasonable Concentration Pathway – not necessarily one of these four – that results in a future climate we think we can live with, then formulate an energy policy and Carbon Plan that will reasonably match its greenhouse gas concentrations and general land use. Let’s look at some resulting RCP energy source scenarios, these being taken from RCP4.5: a pathway for stabilization of radiative forcing by 2100 (Thomson et al. 2011) who took a carbon-tax based cost-minimization approach in their Integrated Assessment Model, and a world-wide global view. From their abstract:
“RCP4.5... follows a cost-minimizing pathway to reach the target radiative forcing. The imperative to limit emissions in order to reach this target drives changes in the energy system, including shifts to electricity, to lower emissions energy technologies and to the deployment of carbon capture and geologic storage technology. In addition, the RCP4.5 emissions price also applies to land use emissions; as a result, forest lands expand from their present day extent... While there are many alternative pathways to achieve a radiative forcing level of 4.5 W/ the application of the RCP4.5 provides a common platform for climate models to explore the climate system response to stabilizing the anthropogenic components of radiative forcing.”
The Integrated Assessment Modeling tool developed is the Global Change Assessment Model
(GCAM).
“GCAM is a dynamic recursive economic model that combines representations of the global economy, energy systems, agriculture and land use, with representation of terrestrial and ocean carbon cycles, a suite of coupled gas-cycle, climate, and ice-melt models. GCAM tracks emissions and concentrations of greenhouse gases and short-lived species including CO2, CH4, N2O, NOx, VOCs, CO, SO2, carbonaceous aerosols, HFCs, PFCs, NH3, and SF6... GCAM establishes market-clearing prices for all energy, agriculture and land markets such that supplies and demands for all markets balance simultaneously. The GCAM energy system includes primary energy resources, production, energy transformation to final fuels, and the employment of final energy forms to deliver energy services such as passenger kilometers in transport or space conditioning for buildings. GCAM contains detailed representations of technology options in all of the economic components of the system with technology choice determined by market competition...
“Carbon prices reach $85 per ton of CO2 by 2100 which transforms the global economy. Electric power generation changes from the largest source of emissions in the world to a system with net negative emissions – made possible by increased reliance on nuclear and renewable energy forms such as wind, solar and geothermal, and the application of CO2 capture and storage technology to both fossil fuel sources and bioenergy
“RCP4.5 (predicts) 310 GtCO2 emitted by the energy and industrial systems over the century... while RCP2.6 has 390 GtCO2.”
Discussion
“...The RCP4.5 scenario is intended to inform research on the atmospheric consequences of reducing greenhouse gas emissions in order to stabilize radiative forcing in 2100. It is also a mitigation scenario – the transformations in the energy system, land use, and the global economy required to achieve this target are not possible without explicit action to mitigate greenhouse gas emissions. However, there are many possible pathways in GCAM and other integrated assessment models that would also achieve a radiative forcing level of 4.5 W/. For example, simulations with GCAM can reach 4.5 W/ even if some technology options, such as CCS or nuclear power, are removed from consideration or even if not all countries enter into an emissions mitigation agreement at the same time (Clarke et al. 2009). Such alternate scenarios have different characteristics – higher emissions prices and different energy system transformations, for example – than the RCP4.5. GCAM can also reach 4.5 W/ under different assumptions of crop productivity growth (Thomson et al. 2010). Changing these assumptions, however, affects the amount of dedicated bioenergy crops grown and the cost of food. Additionally, we have used GCAM to stabilize at 4.5 W/ without a terrestrial carbon policy. In this case, substantial deforestation occurs as land is cleared for bioenergy production. The result is significantly higher land use change emissions, with compensating reductions in energy system emissions. The pathway discussed here and released as RCP4.5 is cost-minimizing, and therefore invokes all available technology options that can cost-effectively contribute to mitigation...”
It’s a mind-boggling paper. If your mind is in need of boggling, this is the paper to boggle it: RCP4.5: a pathway for stabilization of radiative forcing by 2100 Thomson et al. 2011. Here are some “cost-minimizing lower emissions energy technology” mixes the Thomson group obtained:
![[Picture]](../img/RCP45_fig4.png "click to enlarge")
![[Picture]](../img/RCP45_fig11.png "click to enlarge")
Left: Global primary energy consumption by energy source in four scenarios 2005 - 2095, a RCP4.5, b
GCAM8.5, c GCAM6, and d GCAM2.6 (Fig. 4)
Right: Annual GHG emissions (GtCO2-e) for the GCAM simulation of the four RCP pathways (Fig 11)
Note: Fig 4 is ordered differently than Fig 11; the latter appears to read a GCAM8.5, b GCAM6, c
RCP4.5, d GCAM2.6.
GCAM 2.6 and RCP 4.5 are the only ones with a snowball’s chance of avoiding climate catastrophe, and Thomson et al.’s cost optimized GCAM results yield global energy use scenarios highly reliant upon nuclear electricity generation. Here are some details for RCP 4.5:
![[Picture]](../img/RCP45_fig5.png "click to enlarge")
Note that “other” includes non-dispatchable wind and solar; their fractional contribution is somewhat less than their nominal capacity factor.
As the authors stress, this is not the only way to reach the 4.5 W/ limit. But it is cost-minimum by their assumptions, and anything radically different is likely to cost radically more. And although I personally think they still leave a lot of coal being subject to expensive CCS, and the resulting CO2 savings could be obtained far cheaper with nuclear – in section 11.1 we grossly overestimate $13/tonne – I wasn’t the one doing the modeling. To get the emissions reductions needed for RCP 4.5 will quadruple global electric use, and there will be some tradeoff between deploying coal CCS, any coal co-fire requirements to burn biomass, and how fast we can build and deploy new nuclear plant. But again, those are details for the grandkids. For us today, the critical take-home point is that cost and dispatchability matter: renewables are not going to save the planet by themselves. They won’t even come close: we must start ramping up nuclear power production and waste management infrastructure today.
Source: RCP4.5: a pathway for stabilization of radiative forcing by 2100, Thomson et al. 2011
References:
The Beginners Guide to Representative Concentration Pathways, G.P.Wayne 2013
RCP2.6: exploring the possibility to keep global mean temperature increase below 2C, van Vuuren et al. 2011
Whatever happened to carbon capture?
Norway abandons Mongstad carbon capture plans
11 Natural Gas and Production Tax Credits: A Bridge to Oblivion?
The marginal cost of wind at current low market penetration is significantly lower than nuclear. At low market penetration existing fossil load following and peaking plants can balance all of wind’s intermittency, so every MWh of wind can be sold and used. (Not necessarily efficiently.) But in the previous subsection we cited five119 modeling studies that each suggest at the high (80+%) penetrations needed to meet anticipated carbon targets, marginal cost of renewables + storage will exceed that of nuclear by at a factor of one-and-a-half to two. The implication is clear: if we continue to subsidize intermittent renewables preferentially over nuclear – which is precisely what the Production Tax Credit (PTC) does – then we (a) reduce or delay nuclear design advances and construction while (b) possibly increasing intermittent renewable deployment beyond what is optimal for meeting CO2 targets at least cost. Carbon reduction is reduced or delayed either way.
An implication is not a proof; this one may be verified or refuted by modeling.
11.1 Production Tax Credits
Although since 2005 U.S. nuclear has been granted an $18/MWh Production Tax Credit (PTC) that partially compensates for the traditional $22/MWh granted wind and solar, the compensation is only partial and the effects are not the same. (Update 12/20/2013: see errata). As demonstrated by direct observation of operating energy markets, wind PTC can and does result in negative energy prices during up to 10% of operating hours in some markets. From Negative Electricity Prices And the Production Tax Credit we may take home the following:
- “Wind producers can readily turn wind turbines on and off, but have no incentive to do so because they still receive positive margins during negative price hours due to the PTC subsidy they earn when they generate... In the short term, the failure of wind producers to curtail output makes it more difficult for system operators to maintain reliability, and also makes it more costly for them to operate the regional electric grid.”
- “In the long run, the PTC destabilizes the market for conventional electricity as generators that are not eligible for the PTC are significantly harmed by negative prices, both in terms of near-term daily operational decisions, as well as long-term decisions to build or retire generation.”
- “America’s continued reliance on the PTC subsidy therefore will invariably deter investments in the conventional power generation needed to maintain a reliable electric system. Conventional generation is critical to reliability because wind generation often does not produce energy during times of peak electricity demand, while producing at high levels (and driving negative prices) when demand is low. In recent years, about 85% of total wind capacity has not operated during the peak hours on the highest demand days of the year, on average. Controllable conventional generation is thus needed to backstop wind and ensure the lights stay on.”120
Emphasis added. Here “conventional generation” means gas, coal, and nuclear. In light of climate change, few tears might be shed over the premature demise of the odd coal plant. But as illustrated in figure 12, it is nuclear that Production Tax Credits and other renewables subsidies hit hardest. A conventional nuclear power plant, whether load-following or not, has a minimum power floor (typically 25% maximum load if load following, much higher if not) beneath which it may not operate without full shutdown. A restart may take several days. Faced with a negative energy price trough, the nuke operator is faced with Hobson’s choice: he may either pay the grid operator up to $4/MWh121 just for the privilege of keeping his plant operating and on line while the wind is brisk, or he must shutdown, bear restart costs, and be unable to bid (and receive) positive prices in the interim. You know – unable to do what he’s ostensibly in the business of doing.
![[Picture]](../img/share_of_clean_energy_from_total_primary_energy_supply_1965-2012_from_bp_statistical_review.png "click to enlarge")
“Long before climate policy became fashionable, global energy consumption data shows that from 1965
to 1999 the proportion of carbon-free energy more than doubled to more than 13 percent. Since then, there
has been little if any progress in expanding the share of carbon-free energy in the global mix. Despite the
rhetoric around the rise of renewable energy, this stagnation suggests how policies employed
to accelerate rates of decarbonization of the global economy have been largely ineffective.”
Source: Roger Pielke Jr. Clean Energy Stagnation.
Image by J.M. Korhonen: The stagnation of clean energy, with more detail.
Data from B.P. Statistical Review of World Energy 2013.
A similar effect is illustrated on pages 9 and 10 of Electricity production from solar and wind in
Germany in 2012, although there it may be argued that replacement of nuclear power with wind
and solar was the primary intent. See also The shale-gas boom won’t do much for climate
change.
Consider the (seemingly) only marginally less onerous case where the PTC stops at zero energy price and the grid operator is free to accept zero cost electricity from two producers: a wind farm and a nuclear power plant. Which choice minimizes the grid operator’s cost and most benefits his customers? The answer is the nuclear plant. Sure, the nuclear plant owner still loses money giving energy away free when he has fixed operating and fuel costs. But at least he can keep his plant running at its minimum power level and be able to bid positive prices when the wind dies down and the grid’s customers still need electricity that wind is not blowing hard enough to provide. And the grid operator wins because he’s retained the nuclear option in his mix. Unlike gas, he knows the long term trend of his cost for nuclear electricity. And unlike wind, he knows that the nuclear plant will much more likely be there when he needs it. But his customers and PUC expect him to buy electricity at the lowest cost, and if a fixed PTC allows a wind farmer to pay the grid operator to take its energy, then that is what the grid operator must do: the nuclear plant can either pay him more, or shut down. And if it shuts down, natural gas will be burnt in its stead.
Make no mistake: negative energy prices benefit nobody but the wind and solar farm owners. Even the grid operator loses on that one. Robin may justify robbing Peter to pay Paul only if Paul can spend Peter’s money more productively than can Peter. But any electricity consumer who needs must say “Sure, I’ll burn your free energy – but you gotta pay me to do it” by definition cannot burn his free money more productively than the taxpayers from whence it came.
Low natural gas prices exacerbate the problems, because they result in a lower bid price when wind is weaker and energy prices are positive. As consequence you have results such as the permanent shutdown of Dominion Resources’ Kewaunee nuclear plant in Wisconsin this past May. 560 MW carbon free energy – an equivalent gas plant emits 2.5 million tonnes of CO2 each year. No mechanical, maintenance, or operational issues. 90% capacity factor. Exemplary operating record. Recent 20 yr. extension to its NRC operating license. Plant paid for. Gone like a puff of smoke in a fitful breeze.122
See Nuclear Power Cannot Compete with Cheap Shale Gas and Nuclear Plants Vexed at Prices That Shift as Demand Does. For such reasons it is argued that nuclear will never be competitive in unregulated electricity markets, which have become the norm this century in the United States. But to my knowlege (still looking) no one has yet shown that nuclear does not have an absolutely essential role in avoiding climate catastrophe. So something’s got to give, and the most obvious somethings are (a) The Climate, or (b) Production Tax Credits.
It would be one thing if one’s final goal were to build out renewables – that’s what their PTC is there to encourage. But as shown in the previous section(s), if what one really wants is to minimize emission of CO2, then it’s hard to fathom how wind + solar + any amount of natural gas will produce less greenhouse gas than the equivalent MWh delivered from nuclear. Even a 40 year old treasure like Kewaunee.
Wind and Solar Production Tax Credits are a literal license to print money, and should be either modified such that they do not apply beneath some minimum price floor, replaced with Investment Tax Credits or cash grants, or eliminated completely.123 Production Tax Credits were introduced in the late 80’s to encourage growth in nascent new industries. This they have done: wind and solar are now quite mature international business, and no longer need that kind of subsidy.124 Neither does nuclear. None of them do. What we all need is less CO2 – a lot less – and tweaking around the edges not only isn’t going to get us there, it quite likely is making matters worse.
- The 2.2¢/kWh PTC and associated ITC decrease emissions by about 0.3% (page 3), as implemented biofuel subsidies actually increase emmisions (page 6).
- “The committee’s major finding is that the broad-based provisions influence GHG emissions primarily through their effects on overall national output. In most cases, the percentage change in GHG emissions was close to or equal to the percentage change in national output induced by removing the tax provision. A second finding is that the way the revenues generated by eliminating tax preferences are recycled significantly affects output and emissions. A third finding is that the broad-based provisions generally have little effect on emissions intensities. Finally, the committee reiterates that the results are highly sensitive to assumptions about how tax revenues from eliminating the provisions are returned to the economy. We conclude that changes in broad-based tax provisions are likely to have a small impact on overall GHG emissions except through the impact on economic output. However, we caution that these results rely on a single model and therefore require further study.” (page 7)
- “We compared the results of our detailed modeling with those of a comprehensive study of energy tax expenditures by a modeling group at the University of Nevada at Las Vegas’s Center for Business and Economic Research (CBER). The committee used the CBER model to obtain an order-of-magnitude estimate of the impact of all energy-related tax expenditures. Under the methods and assumptions of that study, if all tax subsidies would have been removed, then net CO2 emissions would have decreased by 30 MMT per year over the 2005-2009 period. This total represented about 1/2 percent of total U.S. CO2 emissions over this period. The CBER results are consistent with the basic findings of the detailed modeling studies we conducted – that the overall effect of current energy tax subsidies on GHG emissions is close to zero.” (page 7)
- “First, the combined effect of current energy-sector tax expenditures on GHG emissions is very small and could be negative or positive. The most comprehensive study available suggests that their combined impact is less than 1 percent of total U.S. emissions. If we consider the estimates of the effects of the provisions we analyzed using more robust models, they are in the same range. We cannot say with confidence whether the overall effect of energy-sector tax expenditures is to reduce or increase GHG emissions.” (page 8)
- “Fourth, the revenues foregone by energy-sector tax subsidies are substantial in relation to the effects on GHG emissions. The Treasury estimates that the revenue loss from energy-sector tax expenditures in fiscal years 2011 and 2012 totaled $48 billion. Few of these were enacted to reduce GHG emissions. As policies to reduce GHG emissions, however, they are inefficient. Very little if any GHG reductions are achieved at substantial cost with these provisions.”
Well duh. Ask a silly question, get a silly answer. Suppose one wanted to spend $48 billion to actually reduce domestic GHG emission. Want some numbers? Try these: $48 billion will overnight you 6 Westinghouse AP1000 plus change. Run them in baseload mode to replace an equivalent 6 GW (continuous) from coal. Assume an emission differential of 850 tonnes CO2e/GWh of coal over nuclear,125 and 8760 h/yr. That’s 6 x 850 x 8760 = 44.7 million tonnes CO2e saved each year by our $48 billion let’s-save-some-CO2 investment. Over the 80 year lifetime of the plant, that’s a total of 3.6 billion tonnes CO2e, for $13/tonne CO2e saved. Of course there is a bit more to operating a power plant than just front-end cost, and current EIA estimates for nuclear power is 10.5¢/kWh or $105,000/GWh (which includes operations, maintenance, financing, feul and spent fuel management, and profit) for which one also gets a GWh of dispatchable electricity, in addition to the 850 tonne CO2e saved. In this context, it’s easier to understand power companies’ nacent enthusiasm for nuclear four and five years ago, when prospects for a $10/ton CO2 tax were looking fairly bright.
But back in present-day reality, just what effect would our hypothetical 6 AP1000 saving 44.7 M tonnes/yr CO2e domestically have on global CO2 emission? Negligible: unless we curtail the coal mines, the mining companies will just continue to sell their stuff abroad. Gotta ask the right question...
Such is often the case when faced with a difficult problem that admits several solutions, one of which addresses the problem directly but is itself difficult to impose, while the others are second-best patches that nonetheless seemingly appear to allow at least a partial solution: it frequently transpires that the second-best “solutions” turn out to be worse than no solution at all. From which arises the Theory of the Second Best. Lets look at another example:
11.2 Carbon Taxes and the War on Coal
Well, its not really a war. Because war is not healthy for children and other living things, and we’re talking about coal. Coal means jobs. And jobs mean votes. Jobs and votes are healthy. So as a second-best, President Obama has directed the U.S. EPA to wage a proxy war on coal power plants instead. And the Supreme Court has ruled the EPA has authority to do it.
And to what end? Ostensibly, its because coal is by far the worst emitter of green-house gas, polluting the atmosphere with CO2 and causing uncountable future costs, harm, and death via climate change. So we’ll stop burning it here in the United States.
Not stop mining it, mind. Just stop burning it. Here. But we’ll continue mining and exporting and $elling the stuff to Europe and Asia, so they can burn it for us. There.126 Lowering their energy costs in the process and sucking our heavy industry and electricity-intensive manufacturing jobs overseas along with our coal.
You know: precisely those industries and jobs we’d otherwise need to build-out wind and nuclear sufficient to displace enough natural gas to meet the remainder of our CO2 target, because the coal is being burnt anyway so anything else we won’t be able to do wasn’t going to make any difference either. And the lower coal costs abroad will give them furreners that much more disincentive to not deploy renewables and nuclear of their own, so why should we bother?
Seriously. You cannot make this stuff up.
No. The only way to stop CO2 concentration from increasing in the atmosphere is to stop emitting CO2 into the atmosphere. That’s the only way. Coal is mined to be burnt. That’s where over nine tenths of it ends up.127 If you aren’t going to burn it, don’t mine it. If you are going to burn it and you don’t want more CO2 in the atmosphere, then you’ve got to put your toys away when you’re done. Your mother taught you that. Probably by withholding your toy allowance when you didn’t:
Carbon Capture and Sequestration. Place high enough severance and end-use tax on coal that none is mined for energy whose CO2 isn’t captured and stored. Place high enough severance on natural gas that only enough is piped domestically to fulfill minimal domestic peaking, transportation, process and chemical feedstock needs. Tax end-use preferentially to give CCS healthy incentive. Tax exports to allow like purpose only, and imports to penalize those who don’t play by our rules. Fine-tune and sauté to taste. When we’re done, any carbon tax revenue should be minimal because we won’t be emitting enough carbon to tax.128 Until then we can keep any appreciable carbon tax revenue neutral, which will free up other taxes to create more jobs.
The beauty (if that’s what it is) of carbon taxes is that in addition to minimizing GHG emissions, in the process they can also minimize much of the “us-vs-them” acrimony in the renewables-vs-nuclear debate. A sufficently high carbon tax will prevent unwarranted shutdown of currently operating nuclear plants before their natural time. Beyond that, the market will find a cost-optimized mix of renewables, storage, nuclear, and gas. How much gas will depend on efficiencies of the low-carbon sources and storage, and the carbon tax penalties in the cost function. The tax penalties can be adjusted as necessary to meet CO2 and methane emissions goals. There will be enough energy for everyone, and everyone will have a share.
12 So What’s the Plan?
12.1 Load Growth Happens: Plan for it
We previously estimated the amount of energy available from current U.S. supply of depleted uranium and spent nuclear fuel. Realistically, we’re sitting on nowhere close to 1000 years of already mined and refined U-Pu-transuranic fuel. More like only 500 years, if we’re lucky. The reason we’re talking about 500 years fast-fuel supply on-hand rather than 1000 is because finding the wind, water, solar and requisite backup sufficient to reduce current US electric CO2 emissions by 80% isn’t the final goal. It isn’t even halfway there. The final goal is to reduce total US GHG emissions by 80% (or more) of 1990 levels. Of which electric power currently comprises only 33%:
![[Picture]](../img/chart_percent_co2_emissions.gif "click to enlarge")
![[Picture]](../img/EnergyBySourceAndSector2011sec2_3-1.png "click to enlarge")
![[Picture]](../img/energy_consumption_major_fuel_type-large.jpg "click to enlarge")
1 Quad = BTU = 2.93 x kWh = 2.93 x GWh (From Quad, Energy Conversion.)
From where will the other 67% be obtained? Increased efficiency is all very well and good – necessary even – but will only go so far, after which the large majority of the slack must perforce be taken up by (increased) electric power and possibly hydrogen. Electric cars. Electric trucks. Electric trains. Electric heat pumps. And that “20% Industry” – of what does that comprise? At least 17% is process heat – heat used for making chemicals (including hydrogen) at 800 - 1000 C.129 Population grows as well, with the US estimated to increase by another sixth just by 2025.130 We may have to double current US electric production, at relative carbon emission now 90% lower than today. Does one really think wind, water, solar, and NG will go that distance on their own? The National Research Council doesn’t think so. Their 2010 report, Limiting the Magnitude of Future Climate Change very strongly advocates immediate deployment of new nuclear technologies (as well as renewables), subsidy reform, and implementation of carbon taxes and/or cap-and-trade. It fully deserves an article of its own. Meanwhile, lets look at one of its graphics:
![[Picture]](../img/NRCfigS-1.png "click to enlarge")
![[Picture]](../img/EIA_BAU_Projections_figure_76-lg.jpg "click to enlarge")
(Left) FIGURE S.1 Illustration of representative U.S. cumulative GHG emissions budget targets: 170 and
200 Gt CO2-eq (Gt, gigatons, or billion tons), representing an approximate 80% decrease in US
emissions from their 1990 levels. The exact value of the reference budget is uncertain, but
nonetheless illustrates a clear need for a major departure from business as usual. (Summary, pg 3.)
(Right) Projected electricity energy sources to 2040 assuming no significant departure from our present
economic trends.
To this point we’ve been dealing only with CO2. The NRC takes a broader view, and Figure 16 reflects total US total GHG emissions. Of these CO2 comprises only 84%,131 so the figure is in close agreement with our previous 5.3 Gt/y CO2 of section 10. From Summary page 2:
“(F)or this analysis we have focused on a range of global atmospheric GHG concentrations between 450 and 550 parts per million (ppm) CO2-equivalent (eq), a range that has been extensively analyzed by the scientific and economic communities and is a focus of international climate policy discussions. In evaluating U.S. climate policy choices, it useful to set goals that are consistent with those in widespread international use, both for policy development and for making quantitative assessments of alternative strategies.
“Global temperature and GHG concentration targets are needed to help guide long-term global action. Domestic policy, however, requires goals that are more directly linked to outcomes that can be measured and affected by domestic action. The panel thus recommends that the U.S. policy goal be stated as a quantitative limit on domestic GHG emissions over a specified time period – in other words, a GHG emissions budget...
“(The panel suggests a) reasonable ‘representative’ range for a domestic emissions budget would be 170 to 200 gigatons (Gt) of CO2-eq for the period 2012 through 2050. This corresponds roughly to a reduction of emissions from 1990 levels by 80 to 50 percent, respectively. We note that this budget range is based on ‘global least cost’ economic efficiency criteria for allocating global emissions among countries. Using other criteria, different budget numbers could be suggested. (For instance, some argue that, based on global ‘fairness’ concerns, a more aggressive U.S. emission-reduction effort is warranted.)”
Compare Figures 16 and 8 for RCP 4.5 and 2.6. They are not all that different. To achieve such lofty-yet-necessary goals we need clear-eyed, realistic modeling and cost-benefits analysis. We need a Plan. Toward which end the NRC panel also recognizes the urgent need to resolve the issue of nuclear waste.
12.2 Waste Happens: Deal with it
We need a Plan. France has one. Even thirty years ago when it was less certain, based in some part upon U.S. success with EBR-II,132 the French public was confident a long-term plan for nuclear waste could be developed.133 France, of course, then enjoyed a certain confidence in science and engineering134 that no longer encumbers the United States. As result France today enjoys very low carbon emissions per kWh, second only to deep-hydro countries Norway, Switzerland, and Sweden,135 and correspondingly low price for electricity.136 French commercial reactor waste is recoverable, and France has lead the global effort in researching how to transmute it entirely to shorter-lived decay products prior to permanent disposal.
The United States must come up with something similar. Whether we bury it, burn it, or sell it to someone who can, we’re sitting on 65 kilotonnes spent nuclear fuel that isn’t just going to go away on its own, not for another 170,000 years at least. What can we do? Permanent burial may be both a geologically and engineeringly sound solution – but not in my backyard. 170,000 years is something the earth may be able to swallow, but not anything we Amercans have yet been able to wrap our collective heads around. Spent fuel reprocessing, though popular in Europe, was an idea rejected here by the Ford and Carter administrations. The Integral Fast Reactor closed fuel cyle program was cancelled by Clinton. The government contracted with industry to have a permanent reposity open for business twenty years ago. Yucca Mountain, paid for by nuclear ratepayer taxes, was shuttered this past January. Meanwhile spent fuel rods pile up on-site in above-ground dry-cask storage at both operating and retired nuclear power stations. Its a situation that pleases no one – save perhaps a few radical no-nukes activists – and it’s unlikely the American public will buy off on another massive round of nuclear power plant build without a coherent plan for dealing with waste. Meanwhile, Rome burns.
Dry-cask storage is good for decades, perhaps centuries. Those casks are tough. But they aren’t forever tough and on-site real estate is limited. Uncertainty breeds contempt, and we have put up with the situation quite long enough. We need to know where the stuff is going to go, and when. A few options:
- Bury-it-and-forget-it. This has been Plan A for thirty-five years and isn’t likely to change. But whatever its science and engineering merits, politically it hasn’t washed.
- Declare a National Fast Reactor Plan and implement it. Decide where at least some IFRs and SMR reprocessing sites will be located, and make credible plans to ship spent fuel casks to those locations when they are ready. It may take centuries to burn all our accumulated spent fuel, and if some of those casks must be stored at secure intermediate repositories in the interim, make plans for that. And plans for 300-year disposal of the final decay product waste when the fast reactors are done.
- Leave our spent fuel where it is until the BRICS have advanced their own fast reactor programs far enough to accept it. Then sell it to them.137
I’ve tried not to hide my personal preference for Plan B. There’s just too much already-mined energy in this country’s spent nuclear fuel to just Plan A throw-it-away. Somebody will find a use for it. And Plan C – selling it all to somebody who isn’t American – somehow seems un-American. But charged with formulating a National Plan for Nuclear Waste that must involve considerably more than just Spent Nuclear Fuel (SNF) from commercial reactors, perhaps not surprisingly The President’s Blue Ribbon Commission on America’s Nuclear Future judiciously chooses mostly from Plan A while explicitly leaving Plan B open for future generations to persue should they so choose. From the the Commission’s Final Report Executive Summary:
“The Blue Ribbon Commission on America’s Nuclear Future was chartered to recommend a new strategy for managing the back end of the nuclear fuel cycle... Put simply, this nation’s failure to come to grips with the nuclear waste issue has already proved damaging and costly and it will be more damaging and more costly the longer it continues: damaging to prospects for maintaining a potentially important energy supply option for the future, damaging to state-federal relations and public confidence in the federal government’s competence, and damaging to America’s standing in the world – not only as a source of nuclear technology and policy expertise but as a leader on global issues of nuclear safety, non-proliferation, and security. Continued stalemate is also costly – to utility ratepayers, to communities that have become unwilling hosts of long-term nuclear waste storage facilities, and to U.S. taxpayers who face mounting liabilities, already running into billions of dollars, as a result of the failure by both the executive and legislative branches to meet federal waste management commitments.
“The need for a new strategy is urgent, not just to address these damages and costs but because this generation has a fundamental ethical obligation to avoid burdening future generations with the entire task of finding a safe permanent solution for managing hazardous nuclear materials they had no part in creating. At the same time, we owe it to future generations to avoid foreclosing options wherever possible so that they can make choices – about the use of nuclear energy as a low-carbon energy resource and about the management of the nuclear fuel cycle – based on emerging technologies and developments and their own best interests.”138
I couldn’t agree more.
Although the Commission was not chartered to “offer a judgment about the appropriate role of nuclear power in the nation’s (or the world’s) future energy supply mix”, in their report’s Chapter 11 they do make the following observations about advanced reactor technologies in the context of how they may or may not affect the overall waste problem:
“The Commission reviewed the most authoritative available information on advanced reactor and fuel cycle technologies, including the potential to improve existing light-water reactor technology and the once-through fuel cycle, as well as options for partially or fully closing the nuclear fuel cycle by reprocessing and recycling SNF. We concluded that while new reactor and fuel cycle technologies may hold promise for achieving substantial benefits in terms of broadly held safety, economic, environmental, and energy security goals and therefore merit continued public and private R&D investment, no currently available or reasonably foreseeable reactor and fuel cycle technology developments – including advances in reprocessing and recycling technologies – have the potential to fundamentally alter the waste management challenge this nation confronts over at least the next several decades, if not longer. Put another way, we do not believe that today’s recycle technologies or new technology developments in the next three to four decades will change the underlying need for an integrated strategy that combines safe storage of SNF with expeditious progress toward siting and licensing a disposal facility or facilities. This is particularly true of defense HLW and some forms of government-owned spent fuel that can and should be prioritized for direct disposal at an appropriate repository.
“The above conclusion rests on several practical observations. First, the United States has a large existing inventory (on the order of 65,000 metric tons) of spent fuel and will continue to accumulate more spent fuel as long as its commercial nuclear reactor fleet continues to operate. In addition, the U.S. inventory includes materials with a very low probability of re-use under any scenario, including high-level radioactive waste from past nuclear weapons programs and some forms of government-owned spent fuel. Second, the timeframes involved in developing and deploying either breakthrough reactor and fuel-cycle technologies or waste disposal facilities are long: on the order of multiple decades even in a best-case scenario. Given the high degree of uncertainty surrounding prospects for successfully commercializing advanced reactor and fuel cycle concepts that are, for the most part, still in the early R&D phases of development it would be imprudent to delay progress on developing disposal capability – especially since that capability will be needed under any circumstances to deal with at least a portion of the existing HLW inventory. The final and most important point, which further strengthens this conclusion, is that all nuclear energy systems generate waste streams that require long-term isolation from the environment: nuclear fission creates radioactive fission products.”
Final emphasis added. Whether it’s 300 years or 300 thousand, if we aren’t in it for the long haul, we aren’t in it at all. And we are in it.
More Details
One must emphasize that despite its esthetic appeal, closure of the nuclear fuel cycle
via fast neutron reactors requires much technology that, despite decades of research and sometimes fitfull
government support, is still in its infancy. Generation III+ Light Water Reactors are what can be deployed
at scale today. In particular, the President’s Blue Ribbon Commission on America’s Nuclear Future
reports (page 101)
“Our conclusion concerning the need for geologic disposal capacity stands independently of any position one might take about the desirability of closing the nuclear fuel cycle in the United States. The Commission could not reach consensus on that question. As a group we concluded that it is premature at this point for the United States to commit irreversibly to any particular fuel cycle as a matter of government policy given the large uncertainties that exist about the merits and commercial viability of different fuel cycles and technology options. Rather, in the face of an uncertain future, there is a benefit to preserving and developing options so that the nuclear waste management program and the larger nuclear energy system can adapt effectively to changing conditions. Future evaluations of potential alternative fuel cycles must account for linkages among all elements of the fuel cycle (including waste transportation, storage, and disposal) and for broader safety, security, and non-proliferation concerns.
“To preserve and develop those options, we believe R&D should continue on a range of reactor and fuel cycle technologies, described in this report, that have the potential to deliver societal benefits at different times in the future. If and when technology advances change the balance of market and policy considerations to favor a shift away from the once-through fuel cycle, that shift will be driven by a combination of factors, including – but hardly limited to – its waste management impacts. In fact, safety, economics, and energy security are likely to be more important drivers of future fuel cycle decisions than waste management concerns per se.”
Emphasis in original. Times change. Technologies change. People change. Climates change. Most of the people and decision makers who will take the brunt of climate change have not yet been born, and their perspectives will vary. Any National Plan must be flexible. But we do need one. Our current piece-meal every-interest-in-it-for-themselves approach is simply a disaster.
Update: U.S. Congress has held hearings this summer on the draft Nuclear Waste Administration Act (NWAA S.1240), a product of the President’s Blue Ribbon Commission and Congress, especially Senators Feinstein (D-CA), Alexander (R-TN), Wyden (D-OR) and Murkowski (R-AK). See Congress Needs To Take The Nuclear Option.
12.3 Toward a National Carbon Plan
As we saw in sections 10.5.5 and 10.5.6, American Universities and the United States national labs have carefully developed the tools – ReEDS, GridView, SAM, GCAM and friends – to concoct a credible United States National Carbon Plan. The National Research Council and IPCC contributors have clearly outlined what must be done. The modeling tools are specifically written to include nuclear as part of their optimization solution should we so choose. Our laboratories and universities have the organizational infrastructure and knowlegable personnel with experience with similar studies to do it. Nuclear may not only be the fastest deployable technology to address the problem, it may be least cost as well, perhaps by as much as a factor of two or three. That remains to be seen. What has been seen is that rushing renewables can lead to economic and ecologic disaster. Germany has taught us that. Part of that painful lesson is that as currently implemented, PTC and feed-in tariffs introduce chaos into the electricity market, and do little to actually decrease carbon emissions. By encouraging early retirement of existing nuclear and deferred deployment of new, they may actually result in increased emissions. If wind and solar must continue to be subsidised, they should be so through less disruptive means. At this point in their game carbon taxes alone (or cap-and-trade) should suffice.
Early utility studies showed renewable contributions could be economic up to about 30% penetration – a bit less than the capacity factor for onshore wind. That’s what Xcel showed for Colorado when we embarked on our renewables program in 2004, and is the target set by Colorado’s Renewable Energy Standard for 2020. Xcel has thus far done quite well by it, and expects to slightly exceed the 2020 target. Currently, wind contributes about 12% of the total power in the Xcel grid.139 Interestingly, Xcel also operates three baseload nuclear units at two facilities in Minnesota,140 together providing 1.7 GW and providing nearly 30% of the energy in Xcel’s upper midwest grid.141 Stretching from Minnesota through the Dakotas and Colorado down to Texas, Xcel taps the most reliable onshore wind resources in the country, and can probably provide invaluable insight on how best to integrate nuclear with intermittent renewables.
But we shall need far better than 30%, and industry and the national labs owe it to us to show how that might most rapidly be accomplished at greatest reliability and least cost. We’ve argued nuclear is a critical part of that solution, and waste management is an absolutely critical part of nuclear. Yes, existing commercial SNF may be burnt down to 300 yr levels in fast neutron reactors – but 300 years remains 300 years and at that could still take over a century to burn through just for what we have on hand: the public must know what we are going to do with our spent fuel in the meantime. Uncertaintly breeds only cynicism and contempt. But a national waste management program must manage all nuclear waste, and some of the non-commercial (e.g. defense related) waste is unlikely to ever be candidate for partitioning and transmutation. It will live a long time – hundreds of thousands of years – and must be securely dealt with.
Towards the view of a National Carbon Plan, it might be best to make a public distinction between management of commercial Spent Nuclear Fuel and management of the cold-war leftovers. Though there is much management overlap, one is a past mistake to be dealt with, the other a valuable resource for the future.
I’d hope my fellow citizens may eventually see it that way as well. Education is invaluable, and Pandora’s Promise is a valuable step on that path. Further up the road we need
- A National Nuclear Waste Management Plan that distinguishes past defense waste from ongoing and forward-looking civilian fuel cycles. Three hundred years may still be a long time, but it’s not forever. We need to get behind Congressional efforts with the draft Nuclear Waste Administration Act (NWAA S.1240) to ensure it encompasses the flexible storage envisioned by the Blue Ribbon Commision on America’s Nuclear Future.
- A National Carbon Plan whose purpose is a cost-optimized route to a least-carbon future. I say “least” because we are certain to overrun our 450ppm CO2e limit, and 600 ppm as well if we don’t get moving. If there is to be salvation, we must reduce CO2 emissions beneath the level where the biosphere, perhaps in conjunction with CCS of burnt biomass, can begin to absorb more than we emit. That’s a tall order, but we’ve served it upon ourselves.
- Anticipate a final mix of about 10% hydro, 25% other renewables, 40% nuclear, and 25% gas plus coal co-fired with biomass, all subject to CCS. That’s just a guess: the actual values are for the National Carbon Plan modeling to suggest, and of course “the market” to actually determine as new technologies emerge and ongoing cost trends stabilize. If the models and informed public input say “no nukes”, fine. But whatever it is we need to know how much its going to cost, how long its going to take, and how much total carbon will be emitted in the process.
- Most immediately: Production Tax Credit reform. PTC currently introduce negative price excursions into our unregulated markets, and this disruptive effect must be eliminated. Given carbon tax or cap-and-trade flexibility and sane sustainable energy incentives, it must then be determined whether any unregulated electricity market can handle the distributional and reliability complexities inherent in a high renewables penetration. If one can, then the models might suggest market mechanisms by which our carbon goals can be realized.
13 Conclusions
- Three Mile Island and Fukushima notwithstanding, current generation light-water reactors are by any measure very, very, safe. Statistically safer than any other energy source, including renewables. Generation III reactors will be safer by at least an order of magnitude.
- Generation IV fast neutron reactors will be safer yet, and extend the lifetime of uranium fuels effectively indefinitely. Thorium can stretch “indefinite” by at least another factor of three.
- Spent nuclear fuel Partitioning and Transmutation in fast reactors can reduce the radioactive lifetime of sequestered final waste from 170,000 years to a managable 300 years.
- In the process and at present (2013) demand, our current 65,000 tonnes spent nuclear fuel could by themselves, if burnt in fast reactors, supply all U.S. electric needs for 100 years. The 470,000 tonnes accumulated depleted uranium by-product of LWR fuel production could similarly supply all our electric needs for an additional 900 years.
- Realistically, nobody is going to bury that much usable energy anywhere they can’t retrieve it. Not even us: NRC regulations require any such deposition be recoverable for at least 50 years. If we (or our kids) can’t figure out how to use it by then, we can always do as with the rest of our tech waste: sell it to China.
- Nuclear deployment is probably much cheaper than renewables for the same amount of reliable power, possibly by factors of two or three, and with far less environmental impact at the grid penetration levels required for low-carbon generation sources to seriously impact climate change. We have cited six independent academic and national lab studies to support this conclusion. Although all sources of sustainable energy and storage will be important, the formulation of any National Carbon Plan must seriously consider nuclear as a major contributor to electric power.
- Current U.S. Production Tax Credits possibly result in increased greenhouse gas emissions by favoring moderate-carbon renewable+gas combinations that encourage early retirement and/or deferred deployment of very-low-carbon nuclear.
- Absent U.S. carbon taxes or cap-and-trade, our proposed coal plant carbon restrictions will likely serve only to further subsidize global Business As Usual.
- The previous three assertions are each amenable to economic analysis and modeling.
- Realistically, any deployment of nuclear power reactors on a scale large enough to seriously dent the carbon problem will not be politically acceptable in absence of a politically acceptible National Plan for Nuclear Waste. Congress has finally made a first effort with the draft Nuclear Waste Administration Act (NWAA S.1240). It can be done, and the American public needs to know how it will be done. All of it.
A Resources
Articles:
Options for the Treatment of Spent Fuel from Nuclear Power Plants - Partitioning and Transmutation .
Actinide and Fission Product Partitioning and Transmutation (conference proceedings, pp 85-92)
Advanced Nuclear Fuel Cycles (M.Salvatores’ PowerPoint presentation as pdf.)
Economic Case for the Pyroprocessing of Spent Nuclear Fuel.
Smarter Use of Nuclear Waste. Scientific American 2005. Readable overview of fast reactor fuel cycles and waste processing.
Operating and Test Experience for the Experimental Breeder Reactor II (EBR-II).
Reactors Designed by Argonne National Laboratory: Integral Fast Reactor and links therein.
The Integral Fast Reactor. Y.I. Chang, Argonne National Lab (6 pages, 1988)
What is the IFR?. A short FAQ by George S. Stanford (May 2013)
Plentiful Energy – The story of the Integral Fast Reactor, is excerpted at Cost Comparison of IFR and Thermal Reactors and links therein.
Response to an Integral Fast Reactor (IFR) Critique and links therein.
Impact of Load Following on Power Plant Cost and Performance (51 page pdf)
Technical and Economic Aspects of Load Following with Nuclear Power Plants
Earthquake, Tsunami, and Nuclear Power in Japan.
Sites:
Carnival of Nuclear Energy 169 – a compendium of articles.
Touring ‘Nuclear Energy’ on the World Wide Web. A collection assembled by PBS.
World Nuclear Association Information Library is an extensive online reference.
World Nuclear News is the World Nuclear Association’s daily news site.
Radiation and Reason: the Impact of Science on a Culture of Fear Wade Allison, Emeritus Professor of Physics at the University of Oxford. Radiation and Reason is the title of Dr. Allison’s book. Visit his website and scroll down to “Download Recent Articles” for a wealth of accessible scholarly information.
Science Council for Global Initiatives. Tom Blees, President.
Brave New Climate. Prof Barry Brook and contributors.
The Breakthrough Institute. Michael Shellenberger, Ted Nordhaus, Michael Lind, Matthew Nisbet, and Roger Pielke Jr.
Atomic Insights by Rod Adams.
The Hiroshima Syndrome. Regular Fukushima Commentary and Accident Updates by L. Corrice.
New (Jan 2014): SARI: Scientists for Accurate Radiation Information
Policy:
Blue Ribbon Commission on America’s Nuclear Future Final Report 2012. Closest we have to a National Plan for Nuclear Waste – and by extension power – is this 180 page (pdf) bi-partisan report to then Energy Secretary Stephen Chu. Present Secretary Ernest Moniz is one of the authors.
Limiting the Magnitude of Future Climate Change, National Research Council 2010. Closest we have to a National Carbon Plan, advocates a very urgent and aggressive all-of-the-above deployment of renewable, nuclear, and carbon-capture-and-storage resources, together with early retirement of high-emissions infrastructure and a system of carbon taxes and/or cap-and-trade.
Effects of U.S. Tax Policy on Greenhouse Gas Emissions, National Research Council 2013.
Books:
The Nuclear Energy Option (Plenum Press 1990) is a comprehensive online book by radiation physicist Bernard Cohen.
Sustainable Energy Without the Hot Air is a comprehensive online book by Cambridge physicist and government consultant David MacKay, FRS.
Prescription for the Planet, by Tom Blees (Sept 2008, 426 pages, free pdf download at Science Council for Global Initiatives
Plentiful Energy – The story of the Integral Fast Reactor, by Dr. Charles E. Till and Dr. Yoon Il Chang. (Create Space, Dec 2011, 404 pages)
THORIUM: energy cheaper than coal, by Robert Hargraves (Aug. 2012)
WHY vs WHY Nuclear Power, by Barry Brook and Ian Lowe (May 2010, 128 pages)
B Errata
(12/22/2013) Gt should have been Mt in the “Details” CO2 paragraph of section 10.5.5. (However, the paragraph has been removed in lieu of the 12/22/2013 update to this section.)
(12/20/2013) Nuclear Production Tax Credits. The Energy Policy Act of 2005 does not grant any subsidy to existing nuclear plant. Rather, its $18/MWh is a future provision that will apply to the first 6 GW of new-generation capacity such as the four AP1000 reactors now under construction in Georgia and South Carolina. (Thanks to Rod Adams’ Atomic Insight.)
(02/05/2014) Sec 10.5.5: 3.5 GW new nuclear capacity will save us but 25 Mt CO2e/y, not 25 Gt.
C Addenda
(12/15/2013) Updated the “no-fossils” table following figure 6 to include scenarios with no coal, but still utilizing natural gas. These are discussed in an update to section 10.5.5’s “Details” paragraph on Cost.
(12/22/2013) Added tabulated values of Electic System Costs to Figure (7), and estimated cost of an “85% Sustainable” scenario obtained by simply replacing RE Futures’s Baseline coal generation with nuclear.
(12/22/2013) We illustrate section 6.2’s assertion that “the storage timescale would be reduced from geological to merely historic”:
![[Picture]](../img/EvolutionRadiotoxicInventorySNFa.png "click to enlarge")
![[Picture]](../img/EvolutionRadiotoxicInventorySNFc.png "click to enlarge")
Source: M. Salvatores Advanced Nuclear Fuel Cycles, pp 3 and 19. Also see Actinide and Fission Product Partitioning and Transmutation page 89.
1Loss of neutron reactivity with loss of liquid-phase coolant is known as having a “negative void coefficient”. It is a Good Thing, but not a given thing. Though comparatively simple in coolant-moderated designs, in general negative feedbacks must be carefully engineered into nuclear reactors and their fuel assemblies. The Soviet PMBK-1000 reactor at Chernobyl, for instance, was moderated mostly by graphite and operated with a negative void coefficient in its water cooling system only when its fuel was relatively fresh. Which it wasn’t at the time of the 1986 accident.
2It’s never so simple when humans are involved, and we shall return to Fukushima Daiichi in section 9.3. Also see Fukushima a disaster ’Made in Japan’ and Why Fukushima Was Preventable.
3The second nuclear submarine, USS Seawolf, was launched in 1955 with a liquid sodium fast reactor but later re-fitted with a light-water design in the interest of fleet standardization. The Soviet Union later used lead-bismuth cooled fast reactors in its Alfa class submarines.
4BN-600 reactor and BN-800 reactor.
5Other estimates say 16 or 17 feet.
6A metric tonne is 1000 kg, or 2200 lbs. See Energy-related CO2 emissions by source and sector for the United States, 2012
7 Lifecycle GHG Emissions of Various Electicity Generation Sources Table 2.
8I’ve seen some estimates as low as 200 years. Naturally, fuel cycle engineers are working to make required storage time as short as possible: at present 300 years seems most likely.
9See Options for the Treatment of Spent Fuel from Nuclear Power Plants - Partitioning and Transmutation by Andreas Geist, Institute for Nuclear Waste Disposal, Research Center Karlsruhe (pdf), and Economic Case for the Pyroprocessing of Spent Nuclear Fuel (34 pages, pdf).
10See Once-though nuclear fuel cycle.
11 Radioactive Waste: Production, Storage, Disposal (pdf) page 16.
13See BN-600 Reactor. In September 2013 the United States and Russia signed an agreement that “would grant US projects access to Russia’s BOR-60 fast neutron research reactor for irradiation of fuels and materials.” See Sky is the limit for US-Russia cooperation.
14External stress is another matter, particularly since 911. Yet even here metal-cooled reactors, with their smaller pressure vessles and containments, have an inherent advantage: it’s easier to build a stress-resistant small structure than it is a large one.
15Operating and Test Experience for the Experimental Breeder Reactor II (EBR-II). EBR-II Design Approach.
16Ibid. III-A Power Plant Operation.
17See Accumulating fission product poisons.
18At this point neutron capture by Pu-239 has also produced sufficient Pu-240 as to render the Pu isotope ratios “reactor grade”, and not well-suited for use in weapons.
19Liquid Fueled Thorium Reactor (LFTR) proponents might opine this whole remove-melt-reprocesses-recast-replace operation is needlessly complex, and LFTR’s may achieve the same result far more simply and on a continuous basis. While such is true in principle, at present LFTR’s remain a path not yet taken. More information is available at Energy From Thorium.
20See Purex and Pyro Are Not The Same.
21See Economic Case for the Pyroprocessing of Spent Nuclear Fuel.
23 Fast Reactor Status and a Two Step Closed Nuclear Fuel Cycle.
25See Actinide and Fission Product Partitioning and Transmutation, in particular “Requirements-driven comprehensive approach to fuel cycle back-end optimisation” pp 85,89,90, and Partitioning and Transmutation of High Level Nuclear Waste in an Accelerator Driven System.
26This does not include rivers, which replenish the ocean with about 32,000 tons uranium per year – a fast reactor energy rate of roughly 80 TW.
27See David MacKay’s section on Thorium.
28See BN-600 Reactor.
30 Fast Reactor Status and a Two Step Closed Nuclear Fuel Cycle.
31In particular see INSAG-7 The Chernobyl Accident: Updating of INSAG-1 pages 13, 16, and page 23 items 4 and 5. Basically, the existence of a positive RBMK reactor scram effect had been known since 1983, with no corrective action by the RMBK Chief Design Engineer nor the USSR State Committee for the Supervision of Safety in Industry and Nuclear Power (SCSSINP), p. 15. We shall see safety culture issues arise again at Fukushima Daiichi, where tsunami risks were not mitigated even after the potential danger became abundantly clear to geophysicists and oceanographers.
32See Early Soviet Reactors and EU Accession.
33See INSAG-7 The Chernobyl Accident: Updating of INSAG-1 and Chernobyl: Assessment of Radiological and Health Impacts 2002 Update of Chernobyl: Ten Years On.
34There may also be uncertainty in assigning any long-term health effects to very low-level (near-background) radiation doses. See Nuclear Radiation and Health Effects: Low-level radiation risks.
35The hygrogen was generated by reaction of the hot zirconium fuel-rod cladding with steam in the reactor core after loss-of-coolant exposed the fuel. Plant operators were able to clear the hydrogen from the core and primary containment, but absence of power prevented much of it from being vented through the external stack. Hydrogen accumulated and mixed with air in the upper part of the containment building on the service floor. Be grateful for your dull, boring job.
36As a start, see Explanation regarding the high radiation levels in Fukushima Daiichi NPS on August 31, 2013 (A maximum 1,800 mSv/h beta radiation at groundlevel, 15 mSv/h 50 cm up were found near a contaminated water storage tank) and Japan seeks outside help for contaminated water. At present there appears no significant ongoing contamination of the nearby ocean: see Japan Provides Updates on Radioactivity in Seawater and Tank Leakage, Current Information on Radioactivity in Seawater as of 24 September 2013, and Sea Area Monitoring September 24, 2013.
37See Fukushima Accident 2011: Radiation exposure beyond the plant site.
38See Fukushima Accident 2011: Return of evacuees.
39See Fukushima Accident 2011 Radiation exposure beyond the plant site.
40I-131 itself has half life of 8 days. Two other major radioactive isotopes are Cs-134 (half-life 2 years, beta, gamma decay) and more importantly Cs-137 (half life 30 years, beta, gamma decay) Caesium is soluble and can be taken into the body, but does not concentrate in any particular organs, and has a biological half-life of about 70 days. In assessing the significance of atmospheric releases, the Cs-137 figure is multiplied by 40 and added to the I-131 number to give an “iodine-131 equivalent” figure.
41Also see The Fukushima Accident and the National Accident Independent Investigation Commission Report, from which “In the first few days when information was scarce, evacuation was appropriate while questions of re-criticality were checked out, but within a couple of weeks it was suggested that residents should be encouraged to return home without risk.”
42See The Fukushima Accident and the National Accident Independent Investigation Commission Report, Appendix page 2.
43Why Fukushima Was Preventable page 4.
44See Onagawa, Miyagi and Onagawa Nuclear Power Plant.
45See How tenacity, a wall saved a Japanese nuclear plant from meltdown after tsunami.
46From Why Fukushima Was Preventable.
47See Neutron moderator: Nuclear weapon design.
49See Lac-Mégantic derailment.
50Caused largely by inadequate protection from solar radiation. See CDC’s Skin Cancer Statistics and EPA’s Skin Cancer Facts For Your State.
51See Prof. Cohen’s Chapter 9: Costs of Nuclear Power Plants — What Went Wrong?
52See GE Hitachi ESBWR Nuclear Power Plant and fact sheets:
- ESBWR Fact Sheet
- ESBWR Passive Safety Fact Sheet
- ESBWR Natural Circulation Fact Sheet
- ESBWR Plant General Description page B-6.
53See Load following power plant
54 Energy-related CO2 emissions by source and sector for the United States, 2012
55Global carbon-dioxide emissions increase by 1.0 Gt in 2011 to record high.
56 world energy consumption and electricity generation from renewable energyand Coal & Electricity. Source: IEA 2011.
57After Three Failures UN Climate Summit Has Only Modest Aims.
58CDIAC Frequently Asked Global Change Questions
59U.N. Goal of Limiting Global Warming Is Nearly Impossible, Researchers Say.
60 Why the French Like Nuclear Energy (PBS 1997).
61From Nuclear power in France.
62Merkel’s No-Nuke Stumble May Erode Re-Election Support and The Cost of Green: Germany Tussles Over the Bill for Its Energy Revolution: “There are significantly increasing differences in the energy costs between the U.S. and Germany,” said Carsten Brzeski, chief economist at ING Financial Services’ Brussels office. “There are German companies considering maybe moving parts of their facilities to the U.S. just to go for the much cheaper energy costs.”
63From German energy shift faces headwinds: “Last year German coal production – traditionally an energy mainstay in the country – rose by 4.7 percent for lignite and 5.5 percent for brown coal, and carbon emissions from coal were up four percent. If the trend continues, it would threaten Germany’s goal for 2020 of slashing carbon emissions by 40 percent from 1990 levels.” (Even so, most analysts paint a gloomy long-term forecast for German coal. The question is: Is it gloomy enough?)
64From Wind Energy Encounters Problems and Resistance in Germany: “The wind turbines, whose job it was to protect the environment, are not running smoothly. Germany’s biggest infrastructure project is a mess. Everyone wants to get away from nuclear. But at what price? “Even Winfried Kretschmann, the governor of Baden-Wrttemberg and the first Green Party member to govern any German state, is sounding contrite. But his resolve remains as firm as ever: ‘There is simply no alternative to disfiguring the countryside like this,’ he insists. The question is: Is he right?”
65“Uncertain costs continue to plague nuclear power in the 21st century. Between 2002 and 2008, for example, cost estimates for new nuclear plant construction rose from between $2 billion and $4 billion per unit to $9 billion per unit, according to a 2009 UCS report, while experience with new construction in Europe has seen costs continue to soar.” Nuclear Power Cost. Count a “unit” as 1.2GW. $9/1.2W = $7.5/W or $7,500/kW Figure capacity factor 0.92 and $7,500/.92 = $8,152/kW.
66http://web.mit.edu/nuclearpower/pdf/nuclearpower-update2009.pdf Update of the MIT 2003 Future of Nuclear Power Study (2009).
67where “suitable” and “draconian” are TBD, and not by the consumer.
68Levelized Cost of New Generation Resources in the Annual Energy Outlook 2013 page 1 paragraph 4.
69See Energy From Wind Turbines Actually Less Than Estimated?.
70See Negative Electricity Prices And the Production Tax Credit.
71Or at least a plateau. See Peak Coal in China or Long, High Plateau?.
72Specifically, derivatives of Rosatom’s BN-800 reactor.
73Blue Ribbon Commission on America’s Nuclear Future Executive Summary – page one.
74Chernobyl was direct consequence of a lax safety culture in cold-war isolation. The folks at Tepco and Japan’s NISA could have stood to get out a bit more themselves.
75You know, the ones that filter green light from one’s eyes.
76Powder River Basin, Wyoming. Global prices may be 6 to ten times higher.
77Recent Prices of Natural Gas and Natural Gas (EIA).
78See Use of coal to generate power rises; greenhouse gas emissions next, and Negative Electricity Prices And the Production Tax Credit, and Theory of the Second Best.
79From Wind Power May Be Less Than Thought.
80See The grid of 2030: all renewable, 90 percent of the time (or 99%) and Renewables: The 99.9% solution.
81See Negative Electricity Prices And the Production Tax Credit Why wind producers can pay us to take their power – and why that is a bad thing.
82No kidding. 2030 is but 17 years hence. Meanwhile the Average Age of Cars in U.S. Jumps to Record High of 11.4 Years. My own ride is a ’95 model with only 145,000 miles, easily good for another 7 years, when it will be 25. Although median age is more relevant than average, it could still take 20 years to turn over the entire U.S. passenger fleet: if every car sold from here on out were an EV or PHEV, we still wouldn’t make the presumed 2030 target.
83See Wind Energy Encounters Problems and Resistance in Germany and German Power Grids Increasingly Strained.
84As of November 2012, when German renewables penetration was still less than 25%. From Electricity Pricing. But Germany’s wind-driven electric prices are expected to increase to 40¢/kWh by 2020, so we’d be okay.
85EIA projections. See Introduction to Electric Power: Figure 6.
86See Counting Hidden Costs of Energy and German Power Grids Increasingly Strained
87See Introduction to Electric Power: Emissions Density.
88EIA projections. See Introduction to Electric Power: Figure 6.
89“Peter Lang is a retired geologist and engineer with 40 years experience on a wide range of energy projects throughout the world, including managing energy R&D and providing policy advice for government and opposition. His experience includes: coal, oil, gas, hydro, geothermal, nuclear power plants, nuclear waste disposal, and a wide range of energy end use management projects.”
90Basemetals like uranium and thorium. Australia abandoned its gold standards in 1932, the United States followed in 1933.
91I suspect there’s a lemma lurking around to the effect that any overbuild of a non-dispatchable technology past a market penetration equal to its low-penetration capacity factor, must of necessity increase its cost/kWh.
92Which doesn’t mean renewables would not contribute to an optimal combination of all technologies, only that it is perhaps a bit näive to make the a priori assumption that they can form an optimal solution all by themselves.
93as defined by DCCEE.
94Or misunderstandings. And to cover AEMO’s collective departmental ass in the likely event there are...
95100 Per Cent Renewables Study – Draft Modelling Outcomes page 8.
96California is still relatively small. A larger grid could trade many of those mostly idle power stations for mostly idle transmission lines.
97BREE is Australia’s Bureau of Resources and Energy Economics. Mr.Nicholson proposes replacement of 26 GW coal with nuclear for $91 billion, or $3.5 billion/GW. This is in fact the number BREE’s 2012 AETA determined for Nth of a kind large nuclear plant in Australia. (Nth of a kind costing was also what AEMO assumed for renewables, see above.) Source: Australia’s Electricity: Australian Energy Technology Assessment (AETA).
98100 Per Cent Renewables Study – Draft Modelling Outcomes page 10.
99Ibid. page 14.
100The United Kingdom’s population density is roughly 6 times that of the United States. See List of sovereign states and dependent territories by population density. And at 820 km, her reach is well less than wind’s positive correlation extent. See The intermittency statistics of wind power.
101Executive Summary: page xxi.
102Ibid. page xxi.
103Ibid. pg 1-22.
104See The Case For Combating Climate Change With Nuclear Power and Fracking, with Joseph B. Lassiter.
105It’s also another bushel of apples and oranges: RE Futures placed nuclear operating in its most-economic baseload mode; fossils and biogas are used for load balancing.
106 Annual Energy Outlook 2013 with Projections to 2040 Figure 80 page 73. But large-scale industrial construction costs are fickle. Estimates for nuclear nearly doubled between 2002 and 2008, with not a single plant under construction. (There was a lot of industrial cost inflation going around then.) On the other hand, nukes can last a long time, 60 years for current plant and an estimated 80 years for new, so initial cost can be amortized over a human lifetime and bring LCOE down to the 5¢- 7¢range – if you can swing the financing. The NREL study did not vary cost or performance estimates for conventional (fossil and nuclear) and storage technologies among the modeled scenarios. Improved performance estimates for renewables were allowed in some of their scenarios. Nuclear costs were assumed constant at 2010 values. (Executive Summary, pages 1-18, 1-22,23)
107Nuclear is pretty much a direct drop-in replacement for coal, and it is coal that must most immediately be dropped out and replaced.
108Unlike FNRs, which are magic.
109Ibid. page xxii.
110Ibid page 2-3 (pdf pg 89)
111Ibid. page 2-9.
112And it is a ballpark. At low penetration wind is cheaper than nuclear. Solar may soon be as well. So they will penetrate. The object is to limit that penetration just to the extent where load balancing, transmission, and renewable capacity overbuild increase renewable costs above the simpler nuclear alternative. There is also the issue of how rapidly each technology may be deployed: the goal is to maximally reduce methane and CO2.
113assuming $15 billion for Southern’s two 1.2GW Vogtle AP1000, they should be so lucky.
114 Annual Energy Outlook 2013 with Projections to 2040 Figure 80 page 73.
115The Beginner’s Guide to Representative Concentration Pathways Part 2: Creating New Scenarios.
116 What is U.S. electricity generation by energy source?
117 Energy In the United States (2011).
118 Annual Energy Outlook 2013 with Projections to 2040 page 73. If this be progress, it will be woefully inadequate. (More nuclear on page 47).
119Prof Trainer noted two more.
120As explained in Introduction to Electric Power, “Keeping the lights on” is industry jargon for selling you and me the electricity we need, when we need it.
121The $4 figure assumes the nuclear plant operator is recieving an $18/MWh PTC of his own. Elsewise he’d be looking at paying over $22/MWh to keep his shop open.
122Entergy has announced similar plans to close 620 MW(e) Vermont Yankee at the end of 2014. See Entergy opts to shut Vermont Yankee and Who Told Vermont To Be Stupid? and Potential nuclear plant closures and what could be done to stop them.
123ITC and cash grants are options already offered by the 2009 Recovery Act. See 2011 Wind Technologies Market Report (LBNL-5559e) page viii.
124From Tilting at windmills: “The strategically minded are pushing for more fundamental overhauls. Bold ideas include replacing the pricing distortions with a market based on production capacity rather than output: power producers would be paid by the amount of capacity they had installed rather than the amount of electricity they actually produced...”
125Comparison of Lifecycle Greenhouse Gas Emissions Table 2 page 6.
126See Use of coal to generate power rises; greenhouse gas emissions next. From How to lose half a trillion euros: “The other influence was the shale-gas bonanza in America. This displaced to Europe coal that had previously been burned in America, pushing European coal prices down relative to gas prices...(as result) 30GW of gas-fired capacity has been mothballed in Europe since the peak, including brand-new plants. The increase in coal-burning pushed German carbon emissions up in 2012-13, the opposite of what was supposed to happen.”
127There are other uses. For example metallurgical-grade coal in high-carbon steel. Mustn’t throw out the baby with the bath. But the bath must be thrown: In 2012, our nation’s coal mines produced more than a billion short tons of coal, and more than 81% of this coal was used by U.S. power plants to generate electricity. 800 million tons carbon x 44/12 = 2.9 Gt CO2 each year. Just from coal, just for electricity. See Role of coal in the United States and Quarterly Coal Report.
128In section 10.5.6 RCP 4.5 ratchets carbon price to $85/tonne CO2e by 2080 – at which time nearly all carbon-based fuels are subject to CCS save a small amount of natural gas.
129While metal cooled fast reactors could operate that hot (in principle) high-temperature gas reactors such as General Atomics’ EM2 are specifically designed to operate in that range and provide both electric power and process heat. See Nuclear Process Heat for Industry. In principle solar may also provide process heat – but in chemical process intermittency can bite really, really hard.
130World Population will grow to between 8 and 10 billion by 2050.
131Inventory of U.S. Greenhouse Gas Emissions and Sinks: 1990-2011.
132but perhaps in larger part upon French success with Phénix.
133 Why the French Like Nuclear Energy (PBS 1997).
134French science and French engineering.
135European CO2 per KWh in 2009.
136European Energy Price Statisitcs.
137God knows we’ll need the money: we for sure won’t have the energy with which to make any ourselves.
138What – leave our decendents’ most important lifetime decisions to the kids? Are you sure they can handle it? Honey, we’ve got to talk...
139Xcel: Wind Power on Our System
140Xcel: About Nuclear Energy
141Think about it.